Options expire this Friday, so let’s take a look at the open-interest on SPY, DIA, QQQ and IWM to see if they hint at movement the rest of the week. Here’s the theory: the market conspires to cause the most pain, to cause the most number of people to lose the most amount of money. If the market is to accomplish this, what does it need to do this week?
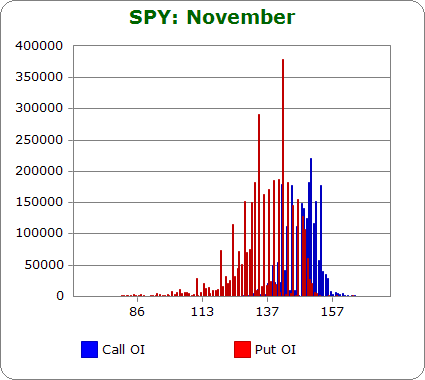
SPY (closed 137.79)

Puts out-number calls 2.0-to-1.0 – slightly less bearish than last month.
Call OI is highest between 140 and 152.
Put OI is highest between 125 and 145.
There’s overlap between 140 and 145, so a close somewhere in there would cause lots of pain, it would cause many options to expire worthless. But puts dominate calls, so a close closer to the top of the range would cause even more pain. With today’s close at 137.79, a solid up move is needed. Otherwise, some of those put buyers will cash in this month..
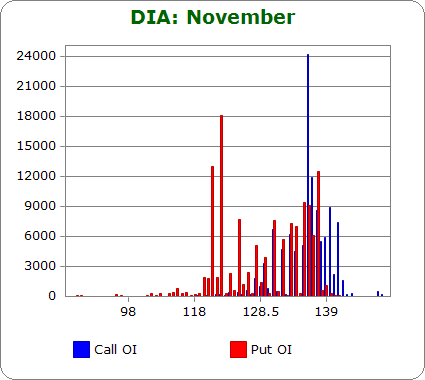
DIA (closed 127.53)

Puts out-number calls 1.5-to-1.0 – more bearish than last month.
Call OI is highest between 130 and 142, but volume is tiny compared to SPY.
Put OI is highest between 122 and 137, but again, volume is tiny.
There’s overlap between 130 and 137, but let’s focus on the cluster between 135 and 137 because that’s where the market needs to close to cause the most pain. Today’s close was at 127.53, significantly below the needed level. Hence a big move up is needed or else those put buyers will cash in.
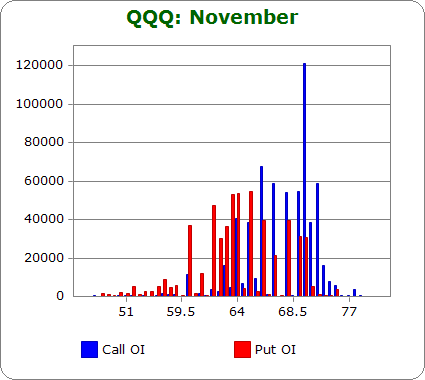
QQQ (closed 62.98)

Puts out-number calls 1.0-to-1.0 – about the same as last month.
Call OI is highest between 64 and 72.
Put OI is highest between 60 and 68.
QQQ options trade in half-point intervals, so the chart above appears very spread out. But the whole numbers are the high open-interest strikes. There’s overlap between 64 and 68. Since call OI is much higher in this range than put OI, a close in the bottom-half of the range would cause the most pain. Today’s close was at 62.98, below the low of the range, so a move up is needed.
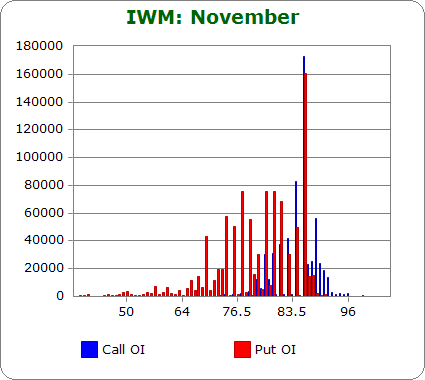
IWM (closed 78.70)

Puts out-number calls 1.9-to-1.0 – less bearish than last month.
Call OI is highest between 84 and 88 with the big spike taking place at 85.
Put OI is highest between 75 and 85 with the big spike taking place at 85.
There’s overlap at 84/85, but let’s focus on 85 since that’s where the big spikes are. A close there would cause all those options to expire worthless and cause all those call and put buyers to lose everything. Today’s close was at 78.70, well under 85. Hence, a big rally is needed. Otherwise those put buyers will cash in.
Overall Conclusion: In the years I’ve been writing this report (usually the Monday before expiration), this is the most lopsided I’ve seen the numbers. Normally, the market is already priced to cause the most pain – only a small move up or down is needed. Occasionally a small directional move is needed. But this month, a big rally is needed. Unless we get extremely good news, the bears are set to cash in big time this month.
0 thoughts on “Using Put/Call Open-Interest to Predict the Rest of the Week”
Leave a Reply
You must be logged in to post a comment.
I have not seen the market behave this way since August 2001. It is not following any of the mathematical models. I suspect a lot of people knew something was going to happen 9/11/01 and invested accordingly. Is it possible the fiscal cliff is causing this behavior or is some radical group or rogue nation planning an event? I would suspect the fiscal cliff since the market has clearly dropped since the election.
Paul
Do you folks own PLCharts.com? If so, no worries…but if not, you may want to contact them to ask them to stop taking your content (look at latest post on their blog).
Yes Eric, PLcharts.com is one of our properties. Thanks.
Cool. Thanks…was just worried someone was scraping your site. Good stuff.
Thanks – appreciate these