Good morning. Happy Tuesday.
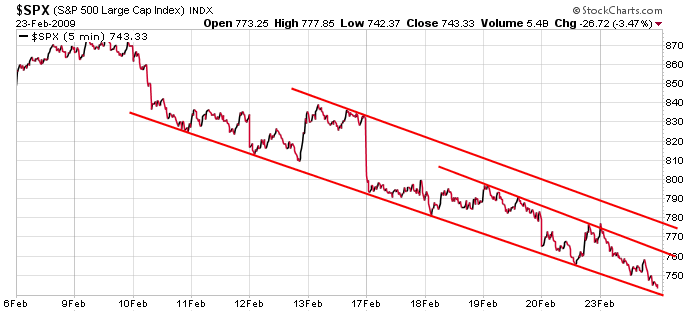
Here’s an updated version of the intraday chart before yesterday’s open. The SPX gapped right up to resistance and immediately sold off. The gap filled, and last week’s low was easily taken out. I still consider the trendlines to be significant because they’re still containing the price movement.

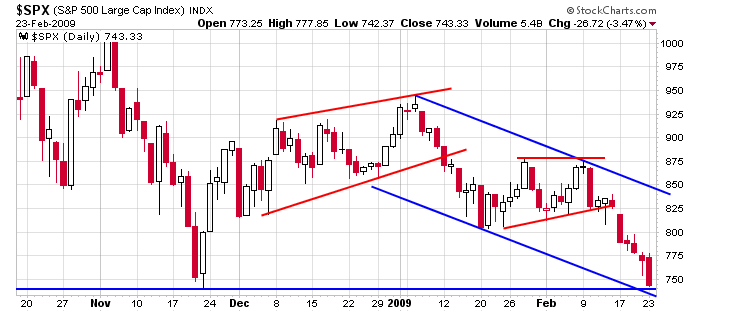
Here’s the daily chart. A line drawn parallel to resistance (upper blue line) and through a reaction low within the pattern suggests we may have a support level not far below yesterday’s close. This level coincidentally coincides with the Nov low.

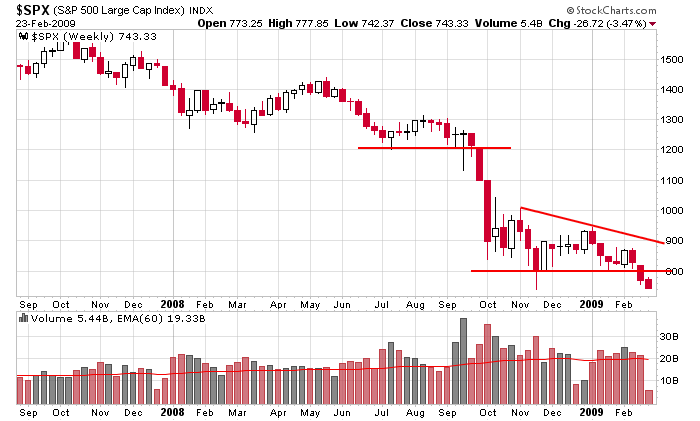
Here’s the weekly chart. A descending triangle has resolved down. The size of the pattern (from 800 to 1000) puts the target at 600.

About an hour before the open, the futures market says we’ll get another gap up which, like yesterday, will be shortable at the open or within the first half hour or so. After some backing and filling, we’ll see if buyers step up to support the market or not.
headlines at Yahoo Finance
movers & shakers from MarketWatch
today’s upgrades/downgrades
this week’s earnings & economic releases