Options expire this Friday, so let’s take a look at the open-interest on SPY, DIA, QQQ and IWM to see if they hint at movement the rest of the week. Here’s the theory: the market conspires to cause the most pain, to cause the most number of people to lose the most amount of money. If the market is to accomplish this, what does it need to do this week?
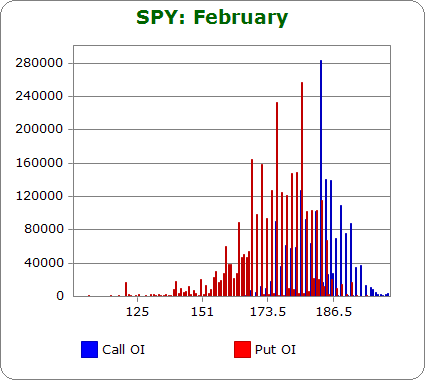
SPY (closed 183.08)

Puts out-number calls 1.8-to-1.0…less bearish than last month.
Call OI is highest at 181, 183, 184, 185, 186, 188-190 with the biggest spike falling at 184.
Put OI is highest between 170 and 184 with the biggest spikes falling at 175 and 180.
There’s a relatively large overlap area, so regardless of where SPY closes Friday, someone’s going to make money. However 180 seems to be an important dividing line. All the big call spikes fall above it and most of the put spikes fall below it. A close close to this level would inflict the most pain on option buyers. Today’s close was at 183.08, a couple points above ideal. A move down is needed the next two days to accomplish the mission.
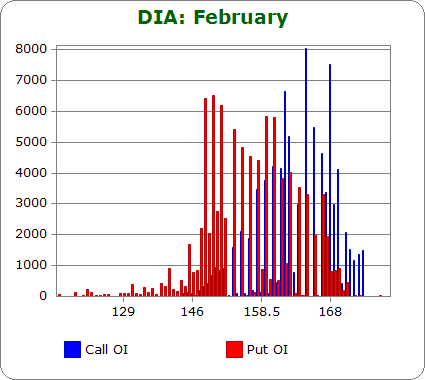
DIA (closed 160.47)

Puts and calls are nearly equal at 1.0-to-1.0….less bearish than last month.
Call OI is highest between 164 and 170.
Put OI is sporadically highest between 149 and 160.
For what it’s worth (DIA open interest numbers don’t matter much because volume is so light) the highest open-interest spikes don’t overlap. A close somewhere between 160 and 164 would cause most calls and puts to expire worthless. Today’s close was at 160.47 – exactly where it needs to be. No net change is needed the next two days to cause max pain.
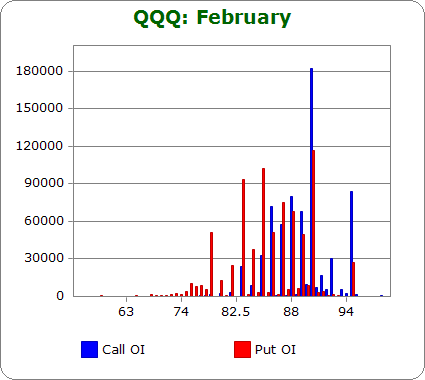
QQQ (closed 89.67)

Calls out-number puts 1.2-to-1.0…slightly less bullish than last month.
Call OI is highest between 86 and 90 and then at 95. The big spike takes place at 90.
Put OI is highest between 83 and 90.
There’s overlap in the 86-90 zone. A close in the 88-89 area would cause the most pain. A few lower-strike call buyers would make money and possibly a few put buyers at the 90 strike (profits would be minimal because at 89, the 90 puts would only be 1 point in the money…how many put buyers bought for less than a dollar?) but overall most could lose or barely get their money back. Today’s close was at 89.67 – a little higher than ideal. Unless the market is set in pinning QQQ at 90, the level of the highest call and put open interest, a small move down is needed the next two days.
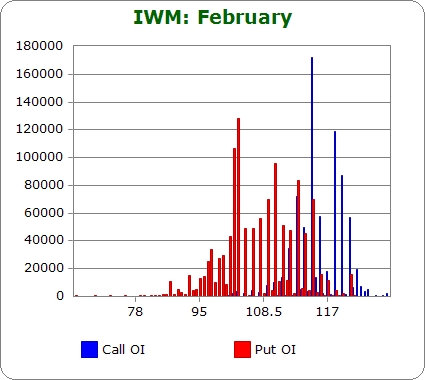
IWM (closed 114.09)

Puts out-number calls 2.3-to-1.0…about the same as last month.
Call OI is highest between 113 and 116 and between 118 and 120.
Put OI is highest between 103 and 114.
There’s definite overlap in the 113-114 area, so a close there would cause the most number of calls and puts to expire worthless. Today’s close was at 114.09…a good spot. No movement is needed to cause max pain.
Overall Conclusion: IWM is already positioned to cause max pain. QQQ, which has led and is not far from a new high, needs to move down a little. SPY, which has also done well lately, needs to move down a couple points. Ideally, SPY would drop moderately and the rest of the market would drop a small amount. I’m not sure what the odds of that specific scenario playing out are, so I’ll simply say the market needs to move down a little the next two days. Flat trading would enable a lot of SPY call buyers to make money while a big move down would enable IWM and QQQ puts buyers to cash in.
0 thoughts on “Using Put/Call Open-Interest to Predict the Rest of the Week”
Leave a Reply
You must be logged in to post a comment.
Appears a major correction has been signaled in the trading of 2/19/14. The RSI and candles are consistent with a decline to start probably at the end of this week or sooner. The weakness today in the IWM was astonishing in the face of a very jittery Dow and SnP. This may be significant since the precursors were the same in 2007, and each time they appeared a correction follows. Look at TFNN.com and down load the free little 5 page report (and sales pitch) by Steve Rhodes who is a competent technician.