Good morning. Happy Friday. Happy Options Expiration Day.
The Asian/Pacific markets closed mostly down. China rallied 2.2%, but Japan (down 1.2%), Australia (down 1.1%), Taiwan (down 0.9%) and India (down 0.8%) fell. Europe is currently posting big, across-the-board losses. Greece is down more than 2%; Germany, France, Italy, Spain, Austria, Belgium, Amsterdam, Norway and Stockholm are down more than 1%. Futures here in the States point towards a relatively big gap down open for the cash market.
Thanks for your votes on my public list at stockcharts.com. Keep ’em coming.
The dollar is down. Oil is down, copper is up. Gold and silver are up. Bonds are up.
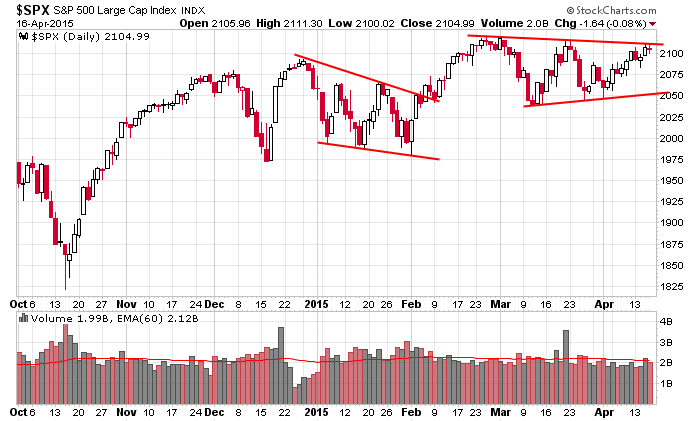
At the risk of sounding like a broken record, this is the daily S&P chart, and until the range resolves, you can’t assume it will or guess which way it’ll go. Rallies get sold; dips get bought. The market hasn’t been traveling very far in either direction before getting turned away. The overall trend remains solidly up, but in the near term we have to be content with little wins and in most cases don’t have the luxury or using loose stops and giving positions time and space to move. It is what it is. Deal with it or don’t play the game.

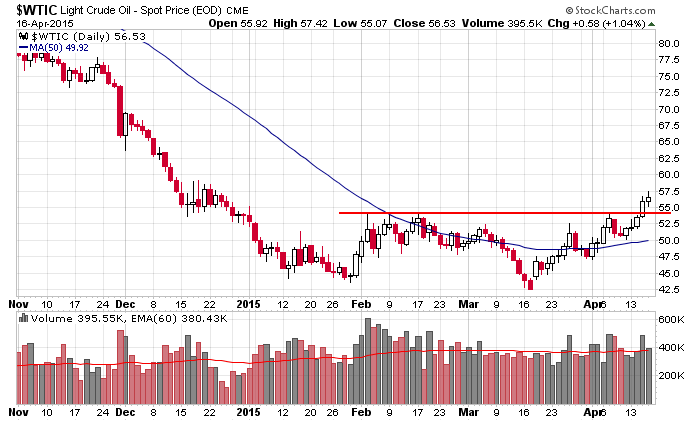
Oil remains the market most interesting group. It’s a huge group with huge potential in both directions. Recently it broke out from a nearly-4-month base and is now at its highest level since mid-December. It takes a lot of buying to reverse a long downtrend. So far, so good. Going forward, follow through would be nice. If profit taking kicks in, we’ll want to see the 50 hold. If it does, this newly-formed mini uptrend could last into the summer. If it doesn’t, back into the 40’s we go with months of sideways slop ahead of us.

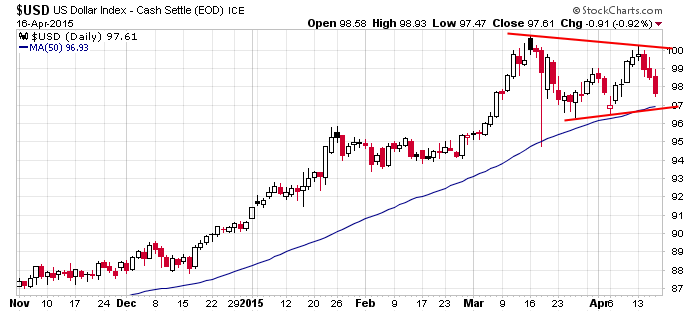
Meanwhile the dollar is down and headed towards it’s biggest weekly drop in a month. It’s also coming up to its 50-day MA. I don’t think the dollar rally is over, but in the near term the bulls have to step up and defend a couple key levels. A dollar drop will help US equities, especially commodities.

That’s it for now.
Stock headlines from barchart.com…
Advanced Micro Devices (AMD +6.30%) slumped 12% in pre-market trading after it reported a Q1 adjusted EPS loss of -9 cents, a bigger loss than consensus of -5 cents.
Honeywell (HON +0.13%) reported Q1 EPS of $1.41, more than consensus of $1.39.
Reynolds American (RAI +0.20%) reported Q1 EPS of 86 cents, higher than consensus of 80 cents.
General Electric (GE -0.66%) reported Q1 EPS of 31 cents, better than consensus of 30 cents.
Goldman Sachs (GS -0.44%) looks like a buy, Barron’s says in its ‘Barron’s Take’ column.
Discover (DFS +0.80%) announced a $2.2 billion share repurchase plan and raised its dividend to 28 cents from 24 cents per share.
Ulta Salon (ULTA +0.39%) was upgraded to ‘Buy’ from ‘Neutral’ at Nomura.
Celanese (CE +0.71%) reported Q1 adjusted EPS of $1.72, much better than consensus of $1.31.
Crown Holdings (CCK -0.51%) reported Q1 adjusted EPS of 53 cents, better than consensus of 52 cents.
Cytec Industries (CYT -1.12%) rose over 2% in after-hours trading after it reported Q1 adjusted EPS of 82 cents, higher than consensus of 73 cents.
Mattel (MAT -0.39%) gained over 6% in after-hours trading after it reported a Q1 adjusted EPS loss of -8 cents, a smaller loss than consensus of -9 cents.
Schlumberger (SLB -0.12%) gained over 1% in pre-market trading after it reported Q1 EPS of $1.06, well above consensus of 91 cents, and said it will cut an additional 11,000 jobs.
American Express (AXP +1.45%) reported Q1 EPS of $1.48, better than consensus of $1.37.
Earnings and Economic Numbers from seekingalpha.com…
Today’s economic calendar:
8:30 Consumer Price Index
9:55 Reuters/UofM Consumer Sentiment
10:00 Leading Indicators
Notable earnings before today’s open: CMA, FHN, GE, HON, RAI, STX, SYF
Notable earnings after today’s close: AMD, ASB, AXP, CCK, CE, CYT, EGP, MAT, NOW, SLB
Other…
today’s upgrades/downgrades from briefing.com
this week’s Earnings
this week’s Economic Numbers
0 thoughts on “Before the Open (Apr 17)”
Leave a Reply
You must be logged in to post a comment.
marsian bear robots have taken over china govt and are now allowed to short markets
does this mean they can now short all markets currencies and comodities
more than likly we just had a false break high corrective wave 2 up
now the start of a large wave 3 down
beware of a bear near you
Jason,
Do you have a track record of your picks over time?
Thanks,
J. R.
J.R. –
I have not kept records of all set ups beyond what is posted in the Archives. This is because everyone trades the set ups differently.
I personally do not trade all the set ups (that would be impossible; there are too many), and since our members have different trading styles and will therefore get different results from the same charts, any track record I attempted to compile would be nothing more than a good guess.
Let’s say a set up is posted that suggests buying a stock when it breaks out at 30 with a target at 35 and an initial stop at 28.5. The stock then breaks out and moves up to 34 over the course of two weeks and then drops back to 31 where a trailing stop was hit. Some members focus on the short term; they would have taken profits on the first or second day. Others would have taken money off the table on the way up and then gotten stopped out close to the top. Still others would have moved their stop up very close when the stock got within a point of the target; they would have kept most of the available profits. And still others would have stubbornly let the decent profit turn into a small profit or maybe even a small loss. The point is that even though each trader was working off the same chart, different results were achieved. This is why it’s not possible to offer an accurate track record. The goal is to save you a lot of time by taking the universe of tradable stocks and narrowing them to a workable number. Then it’s up to you to decide which to play and how to play them.
Despite this, having been in business since 2002, the following can be said: approx. one-third of the set ups breakout and do great; about one-third breakout and end up not going very far; these typically result in a small profit or small loss; and about one-third never trigger. So of the charts that trigger, about half do very well and half end up being small gains or losses. Overall that’s not a bad record.
Thank you for taking the time to provide an answer to my question.