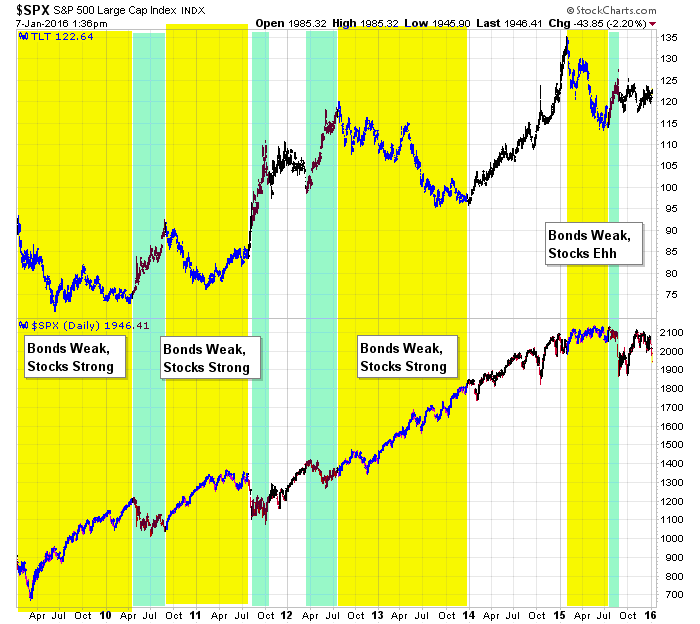
Money often rotates between the stock market and bond market – the safety of bonds vs. the risk and upside potential of stocks. Generally speaking, the two have been loosely inversely correlated. When bonds have sold off, stocks have done well. When bonds have rallied, the market has sometimes rallied and sometimes struggled.
Bonds, via TLT, traded in a range during 2015, much like the overall market. If bonds break out, and there’s no guarantee they will, the stock market could be under even pressure than it already is.
Here’s a chart showing TLT (top) and SPX (bottom). Yellow highlights times bonds were weak; green bonds were strong.

Agree/Disagree? Comment below. And click here to join our email list to get reports just like this sent directly to you.
![]()

0 thoughts on “Strong Bonds (12/12)”
Leave a Reply
You must be logged in to post a comment.
Jase, I think maybe you got the color codes backward? It looks to me like the yellow bands are when the bonds were weak.
Jase, I think maybe you got the color codes backward? It looks to me like the yellow bands are when the bonds were weak. Looking at the last sentence.
Troy…you’re right. I fixed it. Thanks.
Thank you for the good writeup. It in fact was a amusement account it. Look advanced to far added agreeable from you! However, how could we communicate?