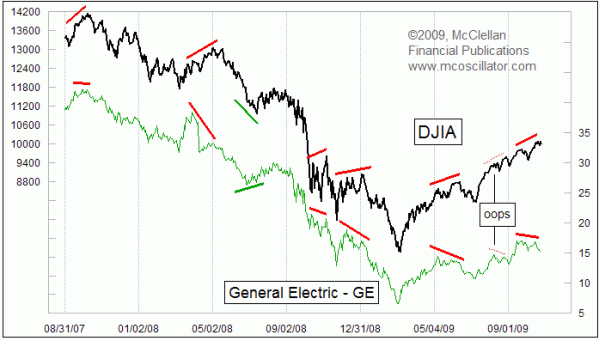
In addition to all the warnings I posted over the weekend (small caps underperforming, Russell underperforming, key levels on index charts, weak market after good earnings), here’s another one I’ve watched from a distance over the years and was reminded of it this past weekend.
The movement of GE vs. the overall market works much like other divergences. Here’s an explanation from Tom McClellan of The McClellan Market Report.
—————————-
This week’s chart looks at the share price of General Electric (GE), which started out as a Dow component in 1896. It left Charles Dow’s average briefly in 1901, returning in 1907 and remaining a member ever since.

Because the DJIA is calculated as an arithmetic average (unweighted), GE’s current low share price of $15.20/share means that it does not contribute as much to the movements of the DJIA as some of the other components. But GE is important in other ways, because it can often signal when a move in the DJIA is about to reverse.
Annotated in the chart are several instances when GE’s price diverged from the direction of the DJIA. Most are at tops, and there is one divergence at a meaningful bottom within this lookback period. The point of calling attention to this behavior is that while GE mostly moves with the rest of the market, it has an interesting ability to signal when liquidity is starting to dry up (or get better) ahead of that change showing up in the DJIA itself.
It does not always work perfectly, and indeed nothing does. During August 2009, GE made a divergent lower high, but the market was able to keep charging higher and GE itself recovered to move to a higher high as well. Now we are seeing another divergence developing, conveying the message that liquidity is once again a problem that should be felt shortly in the overall market.
One frequent criticism of GE is that it is no longer the manufacturing-only stock that it once was. Much of its earnings performance in recent years has come from its financial arms, the leverage of which has magnified the financial performance far beyond what the light bulbs, appliances, wind turbines, and jet engines do for the bottom line. Earlier this decade, that financial performance really helped GE’s share price, and lately it has really hurt.
The financial sector leverage that may seem like a negative for the former manufacturing titan just may be the key to making GE’s share price work so well as an indicator. Greater financial leverage means that GE is all the more sensitive to financial market liquidity. That is a positive attribute when it comes to something that is going to give us an early warning of trouble for the overall market. Illiquidity in the market affects the weak before it goes after the strong, much like the way that bad gas in the coal mines a couple of centuries ago would kill the canary before the burly coal miner. That is why financial canaries like GE are so valuable as indicators.
The lower high and now lower low that GE has made say that liquidity is a problem for the market. It should remain a problem until there is a selloff of sufficient magnitude to produce a decent oversold condition.
3 thoughts on “GE as a Predictor of the Overall Market Movement”
Leave a Reply
You must be logged in to post a comment.
The fundamental problem is overcapacity and American’s value-added is substantially less than our cost-added. Cars and clothes that don’t wear out, they go out of fashion. Life-size TV and computer animation will soon provide no reason to attend sports venues.
Without the next, big thing, generation-x must steal from generation-a to survive. Thank goodness for drones.