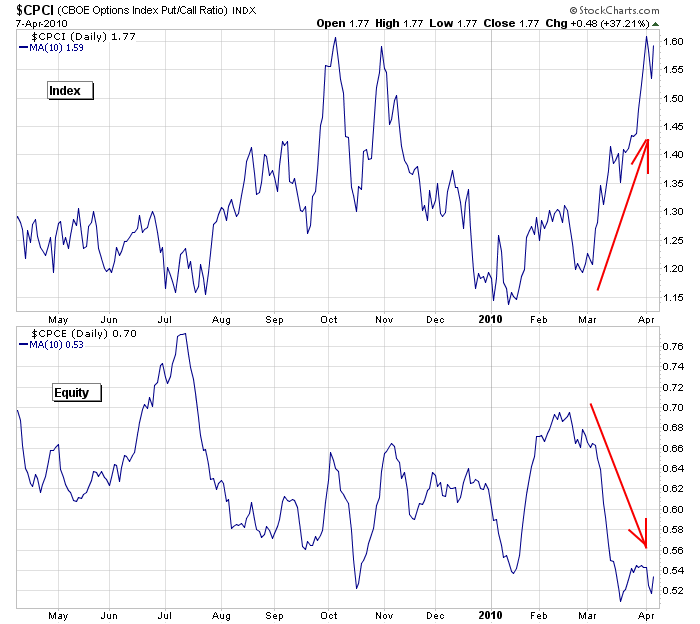
Here’s the index put/call ratio (10-day MA) and equity put/call ratio (10-day MA). Pro traders are responsible for most of the index put/call volume while amateurs stick with trading options on individual stocks, so to some degree, these charts tell us what the smart money and dumb money are doing. Last July when the market made a lower high and lower low and was trading at a 10-week low, the pros weren’t very worried (index put/call was low) while amateur traders were definitely fearful (equity put/call was high). What happened? The market bounced. The pros won; the amateurs lost. Fast forward to today. The market is near its highs and it’s the pro traders who are fearful (index put/call is high) while the amateurs are complacent (equity put/call is low). If the pros are right again, a market top is close.

The only problem with this type of analysis is we don’t know if volume is buying or selling. If the pros are selling puts, they’re bullish, not bearish.
0 thoughts on “Index & Equity Put/Call Ratios”
Leave a Reply
You must be logged in to post a comment.
Sort of indicator that suggests the dumb money is wrong, so the smart money must be correct in some sense? This is an indicator I have never used. What is its value?
Thanks, interesting.
I have not used it either. I just thought it was an interesting chart and wanted to send it out.
fwiw, the last 2 s/t market tops around opex in 10/09 and 1/10, related to the equity p/c 20dma around .57. btw, these tops also happened 2 weeks prior to end-of-qtr for most hedge funds (10/31, 1/31, 4/30). best wishes!
looking at the charts above the same thing happened in the October time frame and the market just kept rising..
Until the advent of inverse ETF’s I put a lot of weight on the put call ratio to predict the market. Even with the new ETF’s the put call ratio bears watching.
Jason this is excellent.
OK so we don’t know if they are buying or selling. So it could be up or down. I have a coin that will give me heads or tails and it’s really easy to toss it.
mr dean please toss it and let us know the outcome. heads i short, tails i go long 🙂
-LOLOL-
Love that last line. The ‘only problem…’ ROFLOL
Whats the use of this? And its the ‘only’ problem!?!?!?! HAHAHA
Can’t stop laughing.
at least the charts are pretty. maybe it’s art. it may not be the best analysis ever, but the price we pay for it is about right. wouldn’t you say mr yeahwho? 🙂
Agreed, you are right abt the ‘price we pay’ comment.
go the big boys–we’ll follow u anywhere u go
Didn’t smart money get us into this mess? You really want to follow them?
I agree with you William.
Jason, if you can’t tell who is the net buy/seller how can you determine who won or lost? All you can say is there was more equity volume in July and more index volume now. My question, should these indexes be in a high correlation to each other? Why should they or why should they not correlate?
I don’t understand this smart money dumb money obsession. If reading tea leafs works then use them. What’s the predictability performance of these indicators in regards to the SPX? Wouldn’t a RSI or Correlation of the indicator against the SPX tell you? Who cares if the smart money won and the dumb money lost? I’m only interested in my money. Grrrrr.