Good morning. Happy Thursday.
The Asian/Pacific markets closed mostly up – there were a couple 1% winners. Europe is currently posting solid across-the-board gains. Futures here in the States point towards a very large gap up open for the cash market that will open the S&P near Tuesday’s high.
As stated yesterday, the price chart looks like the recent action is a pullback within a downtrend, but several key indicators would suggest a structural change is underway and we’re in the beginning stages of a move down. I’m more apt to believe the indicators than the price charts because all large pullbacks have to start as small innocent pullbacks. But the one unknown, the one thing that throws all the charts and analysis techniques out the window is the Fed. They’re playing a role they don’t normally play, and what they’re doing is directly influencing the market to a degree that the charts don’t always matter.
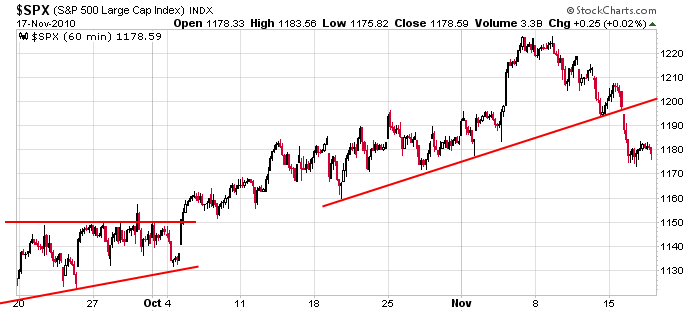
Here’s the SPX 60-min chart from yesterday. As of now the S&P will open near 1190 – 10 points below what I consider a key level.

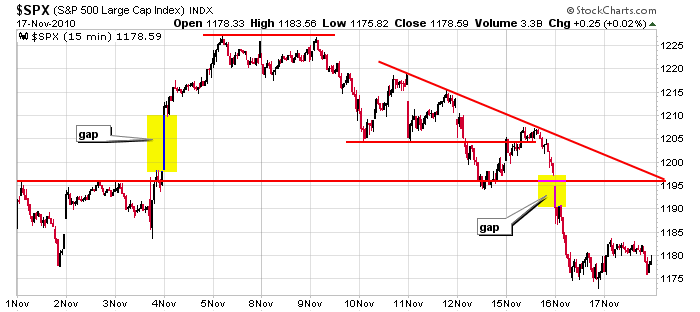
The shorter term 15-min chart tells us 1195-1196 may pose resistance.

So there ya go. From a technical standpoint the area between 1195-1200 is resistance, but we don’t know how useful support and resistance are right now. We traders spend years studying and honing our skills only to find out everything gets thrown out the window from time to time.
Today’s open will be 5 S&P points below Monday’s close…which I’d consider flat trading…which is what was needed to cause lots of pain among option buyers. More after the open.
headlines at Yahoo Finance
today’s upgrades/downgrades
this week’s Earnings Reports
this week’s Economic Numbers
0 thoughts on “Before the Open (Nov 18)”
Leave a Reply
You must be logged in to post a comment.
I find these posts really useful – thank you Jason
Do you know anything about the seasonal effect of Thanksgiving on market rallies?
Aren’t the days around Thanksgiving traditionally up?
The market does tend to do well around holidays, but explain historical tendencies to all the bears who lost their shirts during the Sept rally (Sept is supposed to be the market’s worst month).
(#1) George, just as soon as I have a chance I will
post the bullish seasonal effect concerning end of month/
beginning of month & holidays. It works around 80% of the time. HW
maybe seasonality is the only thing thats going to work here determining mkt direction. after such a waterfall selloff there’s bound to be a rally coming.
(#2) George:: “That stocks tend to rise at an above average rate in the
two trading days preceding each market holiday closing, as well as on
the last one or two trading days of each month, and during the first
four or five trading days of each month.” *This system has been
backtested for at least 30 years and works about 80% of the time.
In my opinion (me talking now): 1)the big traders tend to do all
of their trading ‘prior to’ each holiday and therefore the markets
generally tend to rise on light volume thereafter and; 2) due to contractual
arrangements with union pension plans (and similar plans), these fund
managers are forced to invest their clients monies each month, (which
generally takes place at the beginning of each month) and;
3) if a major holiday happens to fall out at the end of the month
(let’s say on the 31st), then the chances of a market rise are increased
even further. I hope Jason understands my point about this. HW
“I want to short GM on the next leg up!” Great move. I cannot wait for puts to start trading.