Good morning. Happy Wednesday.
The Asian/Pacific markets closed with solid across-the-board gains. Australia, Indonesia, Japan, Singapore, South Korea and Taiwan gained more than 2%. Europe is currently posting similar gains. Belgium, France, Germany and Stockholm are leading the way. Futures here in the States point towards a moderate gap up open for the cash market.
The reason for the buying interest? The German Constitution Court essentially ruled Germany can participate in eurozone bailouts. This of course lessons the odds Greece or another country will go belly up.
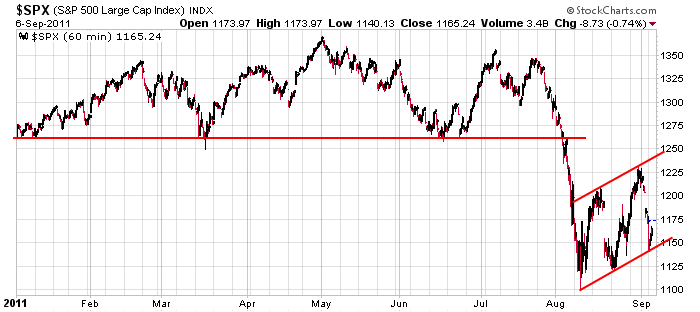
Here’s an update of the 60-min S&P chart I posted yesterday (the trendlines have not changed). The bottom of the pattern has held, and as of now today’s open will be somewhere near yesterday’s high.

The market didn’t do too badly yesterday. Considering the bloodbath that took place in Europe on Monday, the performance was encouraging. The overall trend remains down, and I continue to believe lower prices are coming sooner or later. But hats off to the bulls. They’re hanging in there. Twice the market has made a higher low.
Charts of individual stocks are messy. I don’t see many good set ups (from a chart pattern standpoint). This isn’t a big surprise considering the movement over the last month…down, up, down, up, down and now up. Trading is hard when you get such inconsistent movement…much easier when there is a steady wind at your back. If you’re a good short term trader, go for it. If you don’t have those skills yet, there’s nothing wrong watching and waiting for better opps. More after the open.
headlines at Yahoo Finance
today’s upgrades/downgrades
this week’s Earnings
this week’s Economic Numbers
0 thoughts on “Before the Open (Sep 7)”
Leave a Reply
You must be logged in to post a comment.
re: skills learning: Jason, what about you giving us a
training seminar on Short Term Trading. When you are a
kid and you are learning how to kiss a girl you practice
on a pillow first. So where the dickens are we, the day
trader supposed to learn, grow, etc. if not for you?
I do this all the time on the site in the member’s area. I show my set ups and everything.
As you look at Jason’s chart, one could make the case that this rally off of yesterday’s SPX lower trend line of the “flag” formation has the potential to retest the 1250-1260 area (all within the context of a bear counter trend rally). I’m more focused on the 13 & 20 day declining EMAs at 1185(13 day) & 1192 (20 day)as well as the 80 week SMA just above at 1211. Combined with fibonocci retracement levels in the 1195 -1205 area suggests that this area between 1185-1210 may be important. EW analysis suggests the 1186-1191 area could be the rally destination. I’d look for signs of a failure and reversal beginning at 1185 for a potential short position for a swing or longer term short position somtime this week or early next week.
By the way, the action so far since SPX 1101 is more supportive of my EW 3 wave analysis (as opposed to a larger 5 wave downside move) – in my opinion.
if on the principle that the world is one market
how can some markets show a clear 5 way pattern and some only 3
see german dax or aussie axjo–some are also getting close to the 09 lows
imo EW is deceptive and gives false bias in corrective overlap time phases
and in these corrective phases ew can only be used as a hindsight ind
in conjuction with other inds
imo we are in a corrective phase now –some people wont trade them only impulsive phases
here is what i think happens
as with intraday trading -one index can stall out the other indexes at a piviot
then longer term more advanced indexes wait for others to catch up ect
I was going to give my usual speech about the end of month
beginning of month..oh well..bullish cycle..which is the
last two trading days of the old month and then the first
four or five trading days of the new month. HW
Neal: double check your medication, or better yet call
the local pharmacy and have them put you on a daily
med dispense program, (if they have such a thing) in
Chicago home of Walgreens, one on every corner in fact.
I think E3 is out-of-the-bag.
noticing on some of the stock charts–apple ibm and the oils after filling the long w/e gap
the techs are now rolling over
The point-of-no-return, either it goes up from here or down. I’m short.
Yep, QE3 is definitely out-of-the-bag. Taking losses and going to lunch.
whats that about QE3
The market’s too bullish too calm. Got to be QE3 is out-of-the-bag.
what is dylan doing now
the 50% control point for this spx corrective phase is 1165 and the 1.27 fib is 1270
the dji is 11150 and the 1.27 fib is 12000
but neal doesnt like fibs so down we will go
is that neal the bear and doom /gloom weiss…ies
Has anyone noticed the island top in GLD on the daily chart following yesterday’s outside day to the downside? Does that mean that Gold has made an important top (in U.S. Dollars) and confirm deflation in the USA?