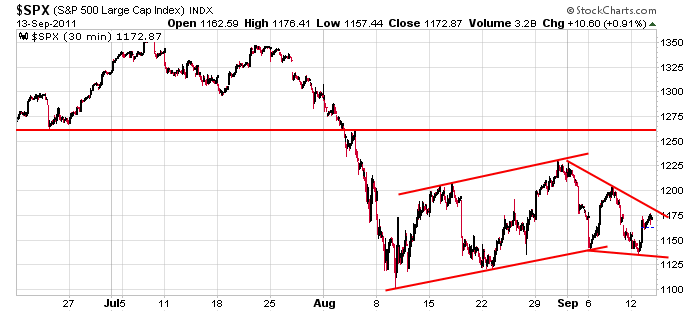
Quick post here. I’ve shown and talked about the bear flag forming on all the indexes. Now we have a new pattern that is potentially bullish short term. A falling wedge is forming that could certainly push the S&P up to prior support near 1260. I’m still bearish long term, but short term you gotta be flexible and open-minded.

0 thoughts on “Bullish Wedge Forming on S&P”
Leave a Reply
You must be logged in to post a comment.
Double top 1225. That’s all she wrote. HW
Jason – maybe, but I don’t think it’s the highest probabiity. I agree that the “flag” is no more, but I think your 20 month SMA will contain any further rally.
check $nya50R and 200R and you will see that the internal strength of the market is good.The market will have a tradeable rally from here.
Maldoror
Unless you can predict what news items will be announced that will affect the markets it makes no difference whether its a wedgie or a flagging broken down flag or a developing diamond without the bottom half or a bulls rearend (TM) and (C). Fear and fundumentals drives markets not the perceived shape of the price action. Price is driven bybuyers and sellers actions. The lower highs and lower lows cam=n only mean onething until a new force enters the markets to change the direction . Newtons Laws look them up, they are really interesting when applied to markets.
BATTY
I agree that potential news right now can jerk the market in any direction, but that news (Greece defaulting) is being priced in. From a technical standpoint the market is still acting pretty well.
Geez! I think I’ll flip a coin.
Regardless of how much about Greece is baked in to the indexes, the market is being driven by the NEXT news. The evidence is the jerky patterns in the charts. That said, the longer term market is showing itself quite well.
The US economy has filtered through all the rebates and is pretty much standing on it’s own shakey legs. I’m seeing more spending in my industry (residential construction in Detroit) (Detroit was in the pits, long before the nation and Detroit will be last to enter good economies).
It looks like the country is headed for another downturn which will stop new spending in a heart beat. I painted this picture to suggest that your chart may just be a delayed head and shoulders. We should know, very shortly. September is never a really good market month, as I recall, but October should give us some direction.