Good morning. Happy Wednesday.
The Asian/Pacific markets closed mixed but with a bearish bias. South Korea dropped more than 3%; Taiwan more than 2%; Australia, Indonesia and Japan more than 1%. Europe is up across the board. France and Germany are rallying more than 2%. Several other indexes are up more than 1%. Futures here in the States point towards a moderate gap up open for the cash market.
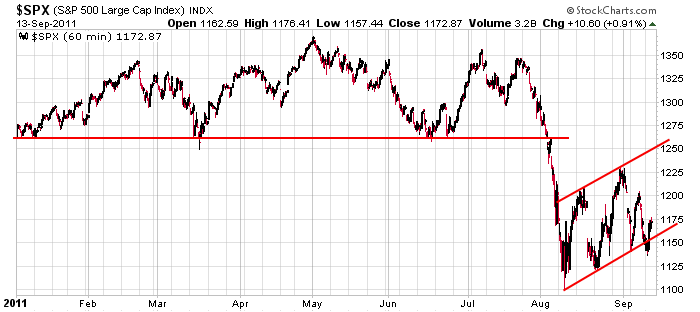
Last week I briefly talked about how flag or rectangle patterns, even though they have parallel trendlines, can get “timed out.” This is because the size of the pattern must be proportional to the size of the move into the pattern. Such seems to be the case right now. The pattern I”ve been following for the last couple weeks needs to resolve down in the next day or so or it becomes invalidated. Here’s the chart. The bears don’t have time for another move up. If a move plays out, I’ll delete the trendlines and start looking for something else.

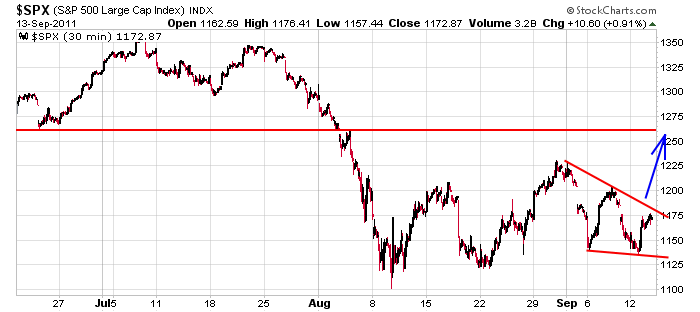
That 60-min pattern is a bigger picture pattern. On a shorter term basis, a bull wedge is falling. A lower high and lower low with converging trendlines is one of my favorites for trading individual stocks because I like stocks that move counter their prevailing trends and especially like ones whose trendlines converge because pressure builds.

I keep telling you to be flexible and open minded, and I mean it. Despite everything that’s gone on in the world recently, the market is unchanged over the last 5 weeks. Long term I’m bearish. Short term it’s entirely possible we get a little boost into the end of the week.
headlines at Yahoo Finance
today’s upgrades/downgrades
this week’s Earnings
this week’s Economic Numbers
0 thoughts on “Before the Open (Sep 14)”
Leave a Reply
You must be logged in to post a comment.
EZU1: short 1172.25
AussieJS – I saw your late day post yesterday. If I understand you correctly, you use the futures (including overnight trading) for analysis. I only use the SPX CASH market during U.S. trading hours. I’ve read pros & cons about both approaches.
Anyway,today’s early U.S. trading has entered the lower end of my target area of SPX 1080-1095. From the week’s low I’m seeing what I believe is a 3 wave rally taking place. At this point, I’m not inclined to get too bogged down in EW wave interpretation as to trying to pin down the end of this rally. I’m looking for signs now of a reversal and acceleration away from my target area. If I don’t see it, I’ll be wary of any down move.
I see Jason has a bullish wedge interpretation. I think the 20 month (my 80 week SMA at 1211) is the maximum upside on a closing basis.
Correction – my target area is 1180 – 1195
ESZ1: Closing half position: This is starting to feel like a bottom.
Hi Pete,
rather than using EW as a trading tool,because of what i trade and how i get a different perspective–i have 10 charts open side by side on 2 monitors,plus another 2 computers and all on the 1 and 5 min charts
this is what i see
—there is no trend currently–everything is highly controled for quad withcing opts ex
thats the big one -the quartly covering many things–instos start the process one week out
they usually make 2 to 3 passes at the one strike so very choppy
—-the ndx seems to be stalling out any downside in spx /dji
—dji is the weakest and following the euro almost tick for tick
compare a 5 min chart of euro and ym-z1 or dji futures–almost identical
—world indexes are all interactive and linked to euro/usd as is usa futures
–looking ahead the instos-hedgies may be looking for a xmas rally–so a big push down first to get the retailers lined up with puts as the hedgies go to calls
oh well just some thoughts of mine
plenty good intraday swings currently if u use piviots but still choppy and my tick ind still showing many large negative extremes–meaning someone is liquidating at any price
AussieJS – even though we trade with different time frame perspectives, your comments are enlightening. So, what’s happening in Euro land is the primary influence on U.S. stock indexes (which makes sense from a fundamental/economic viewpoint) and paying attention to the EURO$ & DAX can be instructive.
Therefore, would you agree that Euro$ & DAX appear to be staging an oversold rally which could push SPX, DOW etc higher in short term i.e. over the coming few days or longer?
just to use a few fundamentals
—the german dax—germany is the worlds 2nd largest exporter and is a mostly tech index
the only one that is allowing shorting in euroland—germany has been hurting and slowing
the dax has taken the brunt of selling—apple can be traded in germany as a lot of the techs–so u get a added correlation—deuther bank is a very large hedgie /bank
—the euro—should be much lower by is highly controled by imf and world central bankers
on a “”””coopperative””” basis—-we news gets bad ,they pump the euro up
Just in passing (and to further muddy the waters), I note that today’s high is an approximate .618 retrace of the move down from SPX 1205 to this week’s low of 1136. 1180 is also testing Jason’s upper trendline of his wedge pattern.
dji -11250—-spx 1185—-ndx 2250—dax
dji 11250-spx1185–ndx2250 —dax 5400 –ftse 5300 all nice strike prices –ah
all just hit–maybe thats it
At 2PM (EDT), I have the SPX at 1188.12 for the day’s high. Assuming a 3 wave pattern (ABC), I believe wave A ended yesterday at 1174ish. Wave B was a “flat” ending at today’s low of 1163ish. We are now in wave C. Wave A traveled from 1136ish to 1174ish, i.e. 38 pts. If wave C = wave A the target is 1201.
As I said previously, I’m not going to get obsessed with EW and get lost in wave count interpretations. We’re in an area of anticipated resistance up to 1211 (my 80 week SMA) with a cluster in the 1180-1195 area (by my analysis). Until I see an acceleration downward, I’m wouldn’t try to pick the top (suppose Jason’s correct and we’re headed to 1260?). My main focus is the larger trend (down)and a search for a low risk entry point on some confirmation of a top to this rally from 1136.
3PM (EDT) – Let’s watch in here for a reversal and downside acceleration from this area around 1195.
Or does it want to hesitate here and reach for 1201?
Well, we saw 1201 hit, followed by a sharp reversal. I’d begin to look for another rally attempt sometime tomorrow THAT FAILS for a low risk entry point on the short side with a stop loss above 1205.
excellent call!