Good morning. Happy Tuesday.
The Asian/Pacific markets closed mostly down, but only India (down 1.4%) moved more than 1%. Europe is currently down across the board. France and Austria are down more than 2%. Belgium, Germany, Amsterdam, Stockholm and London are down more than 1%. Futures here in the States point towards a sizable gap down open for the cash market.
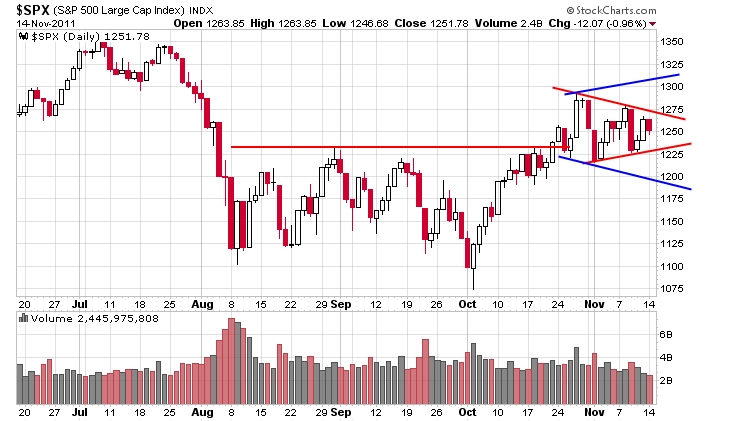
Yesterday was an inside day, so besides a lower high and higher low being put in place on the daily chart, pressure is building on a shorter term basis. Here’s the daily S&P. The index has dropped consecutive days only once in the last six weeks. It will be a challenge to avoid such an occurrence today.

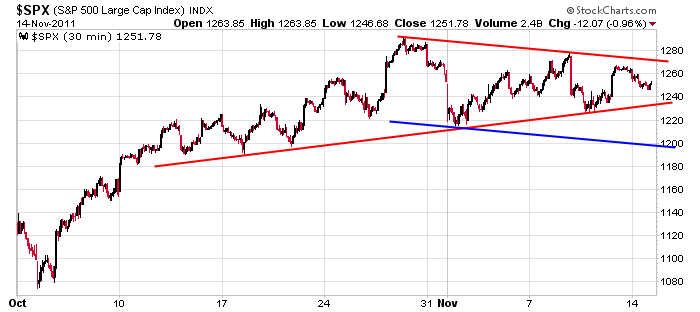
Zooming in, here’s the 30-min. If support gets taken out, 1200 will be my target. It’s established drawing a trendline parallel to the upper trendline and through the low of the pattern above.

My bias remains the same. The intermediate term trend is up, but there are things hovering over the market that won’t let it leg up again. Besides Europe, the Super Committee is getting headlines, and they’re not good. Even though there are many good looking patterns, I’m still playing it safe. More after the open.
headlines at Yahoo Finance
today’s upgrades/downgrades
this week’s Earnings
this week’s Economic Numbers
0 thoughts on “Before the Open (Nov 15)”
Leave a Reply
You must be logged in to post a comment.
Everyone sees the potential “e” wave completion occuring now on the daily SPX chart and,on an even smaller time frame,a possible “head & shoulders” bottom on a 5 minute chart. Can it be that obvious to position on the long side on a break above 1253 (neckline) of H&S pattern?
intraday insto futures traders usually go for gap fill ie previous close if possible on opening–especially around opts time–if no gap fill in 45 mins of open then the way the trend is heading is the direction
europe has had a drop and recovery problem
and spx futures may have had a “E” at lower levels,but will the e be resolved to the up side
i will have to ask santa
The early upside breakout failed so now perhaps we test yesterday’s SPX low. Below that, I’ll look for signs of support from 1242 down to 1232, assuming we’re still watching an “E” wave of a bullish triangle completing.
from the oct lows the ftse and dax are interesting charts
with all the turmoil in europe ftse and dax have given us a long time wise h/s sideways
with a oct pop up head
imo the next move will be down to the oct lows
I’m short SPX at 1250 but I’ll cover if we don’t break yesterday’s 3pm low around 1247
spx——-imo wave 2 finished late oct
and we are now in a small triangle or h/s for small sub 2 of larger 3
if so pos after opts ex or on the 18th we should start a move down to oct lows and below
santa has been asked to run for politics but declined
I’d expect to see 1242 at least on the downside.
I’ve learned to get out as noon approaches so I covered my short at SPX 1246 and will eat an early lunch. The question now being, did we complete wave “E” at today’s low? I’ll wait until after 1PM and see if today’s low can hold a retest.
Maybe a short position on a downside reversal from around SPX 1260 would be a low risk short position with a tight stop loss.
Short again at SPX 1258
I think we’re in a Wave3up. 60day 60minute chart. Wave1up 10/4 to 10/27 Wave2dn 10/27 to 11/1; and Wave3up 11/1 to present.
Also, draw a trend line from 9/12 low, 10/18 low, 11/1 low and extend. I think that’s the slope.
P.S. I’m using the 60day 60 minute chart of ESZ1, the S&P emini.
RichE – I think the trendline you’re noting corresponds to the lower support line of the daily SPX triangle I mentioned. Earlier, I covered my SPX short just above breakeven and I’m done for today.
Yes, the last few points of the triangle rest on trend line. The triangle starts at 10/27ish. I started the trend line at 9/12. Six weeks earlier.
I think the triangle will go down to 1237 this week then breakout next week, Wednesday, on settlement day.
It looks like the EUR/USD and ESZ1 are diverging as of Nov 1. A higher dollar, lower commodity prices, lower commodity prices should goose the equity market. Maybe that’s the hand. I’m going to call it the Obama hand. The hand that stimulates.