Good morning. Happy Friday.
Europe is mostly down, but no index is more than 1% moved from its unchanged level. Futures here in the States point towards a negative open for the cash market.
The dollar is down. Oil and copper are up. Gold and silver are up.
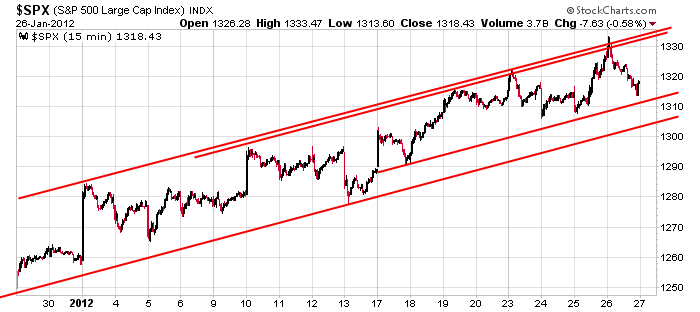
So the market finally pulled back yesterday. The closing numbers weren’t bad, but the move off the early high was noticeable. Here’s the 15-min SPX chart going back a month. There’s no denying the trend or relatively tight and consistent channel which has contained the price movement.

It’s entirely possible a local top was established yesterday. It’s also possible the market moves up and takes out the high like it has many times the last six weeks. After all, yesterday was just a single down day. Big deal.
I’m not in the predicting business, so I have no interest arguing whether a top is or is not in place. I’d rather consider several different scenarios and have a game plan for dealing with each. Then it’s just a matter of executing.
To make money trading, you have to be comfortable being uncomfortable. You have to be able to operate in an environment where you don’t know what will happen next…like a baseball player not knowing what pitch is coming next. Sometimes it’s easy to guess what’s coming. Other times it’s a coin flip. This is trading. You never know for sure what will happen, and you just have to be comfortable operating under such circumstances or you don’t. Thankfully you are permitted to sit on the sidelines and wait. You don’t have to swing at any particular pitch. If you’re not sure, wait. There will always be another day and another trade. More after the open.
headlines at Yahoo Finance
headlines at MarketWatch
today’s upgrades/downgrades
this week’s Earnings
this week’s Economic Numbers
0 thoughts on “Before the Open (Jan 27)”
Leave a Reply
You must be logged in to post a comment.
>>””To make money trading, you have to be comfortable being uncomfortable””<<
How true, which is why I rarely trade unless I have studied the charts in several forms so I don't just project what I want to happen into a trade. Very few fundamental interest me. Yes you need to be aware of some fundamentals like Options expiration, earning dates, dividend dates and breaking news.
Love your last paragraph today ! So true.
what happened to y/days comments—was no one trading
apart from Jasons realistic views ,i also like reading the comments of others
AussieJS – Jason’s “Before the Open” email yesterday that I received had no comments from Jason or anyone. Maybe a glitch.
Anyway, a break of SPX week’s low (1306ish) would persuade me that wave 3 of C is finally over. I’m thinking a wave 4 correction would then last through the end of next week. So far, I’m seeing a potential 5 wave impulsive decline on the hourly chart with an upside mid day bounce trying to take hold. If a bounce finds resistance around today’s open (1318ish) or higher to, say 1322, I’d try the short side – but only on a reversal pattern. I gotta say, it may be easier to watch for any pullback to play out & trade long in tune with the trend. I still think the May high is going to be tested during a 5th wave advance. Only a pullback below 1267 would force me to reconsider and think 1333 may have completed wave C.
It looks like a nice downward ending diagonal (wedge) may be ending to complete the initial move down from SPX 1333. If so, I’d be looking for today’s open as the minimum upside target.
yes i agree Pete
spx/ndx sideways choppy for quite a while
but dji in a strong downtrend and may led the others or it will give in and follow spx/ndx
I looked at dji and it seems to be more impulsive downward than SPX but should bounce as well, imo. RUT & NDX look stronger so I gotta think that, overall, the indexes will consolidate in various patterns over the next week and then rally again. At least the picture seems to be a little clearer, at least as I see it.
Thanks Pete for the insight….me thinks down a bit too….Lack of conviction seems to play it out….
I don’t mean to be too chatty here, but the EW picture seems to be more clear, imo. The opening level is the beginning of the downward wedge pattern and where you would expect a bounce to target at a minimum. We’re almost there at 3pm. If SPX trades above that level, 1320-1325 is the .382 to .618 approximate rebound area. Above that and I think we could be looking at a sideways congestion (wave 4 triangle?) to eat up time. 1306 seems a more and more important support area to breach in order to expect a deeper correction.
I’m in for a 4th wave correction to as much as 1277. A break of 1306 (current trend line break) would be a good indicator. Then, a 5 of C of Y (double zig zag) rally. This count indicates a nasty resumption of a bear following the conclusion of 5. If May’s high is broke, it’s back to serious re-evaluation. Have a great weekend.