Good morning. Happy Friday.
The Asian/Pacific markets closed mixed and with a downward slant; China, Hong Kong and Japan lost more than 1%. Europe is currently most down; there are no 1% movers. Futures here in the States point towards a flat to down open.
The dollar is down slightly. Oil and copper are up slightly. Gold and silver are flat.
Since the Russell cleared resistance and joined the other indexes in higher high territory, we’ve gotten three down days. Most of the downward movement has come in the form of opening gap downs, and the intraday selling pressure has equaled the intraday buying pressure. In fact, looking at the closes relative to the opens the last three days reveals a small gain, so whatever caused the gap downs was not able to exert itself during regular trading hours.
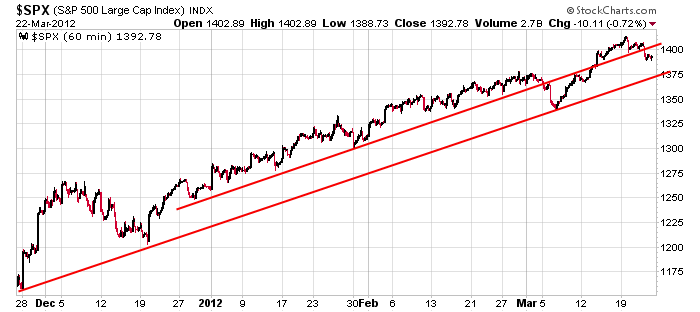
Here’s the 60-min S&P chart going back to late November. The trend remains rock solid, and since tops take weeks or months to form, even if a top were in place, we’d get several more upward thrusts (ergo, plenty of opportunity to get short). But as I’ve said many times, do not use the movement of the indexes as justification to stay in laggard. Just each position in-and-of-itself. Do not fall in the trap of holding a crappy stock just because the indexes remain in an uptrend.

It’s Friday and the near term is in question. Maybe the S&P wants to test 1375, or maybe it’ll undercut 1375 to scare the bulls (I’m not the only one looking at this chart). In either case I’m not in a big hurry to enter new positions right now. More after the open.
headlines at Yahoo Finance
headlines at MarketWatch
today’s upgrades/downgrades
this week’s Earnings
this week’s Economic Numbers
0 thoughts on “Before the Open (Mar 23)”
Leave a Reply
You must be logged in to post a comment.
the fed is selling into the end of qtr window dressing. this is a chance for everyone that was crying for a pullback to get in.
…and nest week is the end of the first quarter… i would think the odds favor some love to make everything look real pretty…
homebuilders are being made to tell the truth… again. sell hope buy fear
Hey Pete, 4 might just be done. Up for 5 now. What’s your take?
{snip}”… whatever caused the gap downs was not able to exert itself during regular trading hours.”
That would be Aussie shorting the Asian market. LOL
ur right RichE—the futures is the game
europe game us a merry chase
i shorted the ndx 100 cash futures at 2750 for the ride all the way down
on everything–dax ftse dji spx ndx ect
the bounce was me changing sides
dont know where we are going now but that europe just closed –12.30 pm ny,back up at its highs
this is called world market distribution after a top
That’s a healthy bounce. I’ll be going long if the next leg is strong.
fed had to jump back in with the fist full of dollars because of the shitty housing news. back to the sit and stink. to bad it was just starting to move around pretty good
spx–if this is a large ABC from aug /sept lows then we are done with a completed 5 wave up
and wave b –a triangle
it will be followed by a distribution–in now –before we go down
if not we can have one more push up to complete by april fools day
its all the same to me –i cant think beyond a 24 hour period
i like the excitement of the live 1 and 5 minute casino
B push up to Aprial.
the carry trade funding currency has moved back to the japanesse jpy
giving them the freedom to play with the euro /or usd
euro very volitile today
tonites euro bounce was the swiss trying to force down their frank against all
the big game ofcorse is currency wars played to the tune of starwars
cnbc calls it a trading range. what a croc of shit. what it is, is the fed raming their flag up the shorts ass and holding it there, while they look around grinning
Brian – I agree that the pullback into today’s low is a 3 wave corrective affair that could have ended your wave 4 or some other corrective interpretation. However, I’m watching SPX 1404ish (.618 approximately of the decline from 1414) to see if it becomes resistance. I say that because this 3 wave decline could be wave “a” of a larger ABC decline. E.G. if this rally would terminate at the .618 retrace (1404ish) to complete wave “b” then wave “c” down would = wave “a’ at 1377ish, which is roughly a 50% retrace of the rally from 1340 (and the 1378 breakout area). It also comes in around the support area of Jason’s lower SPX trendline support. It’s not a prediction – just an observation.
it could be flyin monkeys comin out of someonmes ass
just kiddin
Geez! I hope so.
I’m doin him a favor. Anyone that thinks this market is still controlled by ta should not be trading. I’m serious
Russ – Thanks for the opinon. I’m serious.
LOL. TA doesn’t control. Were you using TA to forecast the market?
I concur.
just a observation Pete,
if the high was in a few days back–intraday 15 min would u say this move down to todays low was 5 small waves the bounce up today is A and a little move down mon =b then a move up to
1404 ish C FOR A WAVE 2
the next down imo goes much lower than the 1270-5 support but
just on possibility of many—not a probability
If Neal would only come back, it would complete the circle.
“Neal” is working on his dow 14000 t shirts