Good morning. Happy Monday. Hope you had a nice weekend.
The Asian/Pacific markets closed mostly down. Only Japan (down 1.7%) moved more than 1%. Europe is currently mixed. Austria and Belgium are down more than 1%. Futures here in the States suggest a flat-to-slightly-up open for the cash market.
The dollar is up. Oil and copper are down. Gold and silver are down.
I don’t have anything to add to the report I wrote over the weekend. The long term trend (we don’t trade off the long term trend) is up, but the short term trend and sentiment have taken a turn down. The breadth indicators are not in great shape, and many key groups and stocks have weakened in the near term. Also, my bottom-up approach reveals very few good long set ups and many good shorts.
We don’t know if this will end up being an innocent pullback within an uptrend or a full blown correction. Our job is to play the odds and then play good defense.
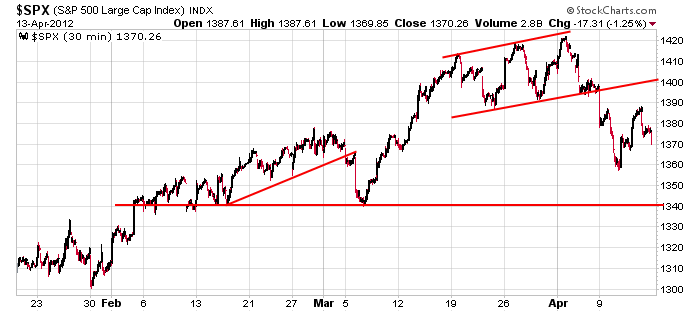
Here’s the 30-min S&P chart. I still consider resistance to be at 1400 and support at 1340, and with last Friday’s close at 1370, the index is smack in the middle of this range.

My near term bias is to the downside, and I’m maintaining my defensive posture. More after the open.
headlines at Yahoo Finance
headlines at MarketWatch
today’s upgrades/downgrades
this week’s Earnings
this week’s Economic Numbers
0 thoughts on “Before the Open (Apr 16)”
Leave a Reply
You must be logged in to post a comment.
keeeeerist if this is all the faster we can fall, we wont hit 2700 til oct
Yo Pete! Don’t know if you caught that I had responded to you on Friday. So, here is that response repeated:
I’m not yet confident on the completion of C. But, I am acting as if it is. Confidence increases if 1357 is taken out prior to any rise above 1392. There is confusion between the cash and futures counts. The reason I use the futures is the off hours trading and greater density within the patterns because of that. If C is done, then 5 of C is painful to count in the cash index. But, it is a much cleaner count in the futures. The high in the futures is on 3/27. Whereas the high in the cash is on 4/2, providing a difficult count. But, if C is not complete, then the high on 4/2 on both indexes would be a B of 4 of C with a 5 yet to come. The problem with that is that the rally from 1357 to yesterdays high is 3 waves. So, ????
Yo Brian! I saw your message from late FRI. I agree with your view. Watching the decline from SPX 1422 (or if your prefer, use your futures), how do you see the decline from 1422 to 1357, i.e. 3 waves down or 5? I can make a case for either (always the problem) so I’m more inclined to watch the trendline from the OCT/DEC lows and the 50 day EMA. Whether 3 or 5 down to 1357, the 3 wave advance from 1357 hints that we go lower to at least test 1340. If that happens, we can better assess whether wave C was completed of we’re looking at 4 of C.
how far we fall depends on the fed stalling the decline until fundimentals ie jobs and housing improve and the market can substain itself
I like the form from 1422 as 5 waves. But, I can’t seem to identify a 3rd long enough to be real comfortable with the count. As you said, it’s ambiguous. So, we are needing more evidence. But, if I use the earlier high on the futures, there is still a strong case for a 5 down from 3/27. Still needs to make new lows prior to any overlap of the low on 3/29, 1340 is still that initial target for a new low. We’ll see.
we go through the 50d by 10 pts… then we crawl back to just above it… now we just sit here.
this is the bullshit I’m talking about. f’in fed dragging it out. M A N I P U L A T I O N
this is why the e brokers have to give away free trades and cash to attract business. the fed is driving traders out of the market. govt control. trying to turn us into drones
An inverse correlation to the dollar seems to continue to be prevalent intraday.
yeah europe’s boomin. This is what it must have felt like being a Christian in rome 2000 yrs ago. pure bullshit
when the free market is repressed, our freedom is repressed. how ironic obama has made us slaves
the closing hour could be interesting
jobs declining, housing sentiment dropping, dow up 100 and frozen.
imo it feels like a sideways distribution that could last into opts ex and another 2 weeks of earnings—todays tick ind is more bullish than bearish—and no compulsive moves
i vote for apple to t/o and buy out the fed–perhaps a reverse t/o
Brian – Since SPX 1357, we’re looking at 3 wave patterns on the hourly chart. I’m thinking we could see an “abc” up with c = a at the 1397-1398ish area which is around the .618 retreace of the 1422 to 1357 decline. If it unfolds that way, I’d be more inclined to view the 1422-1357 decline as 3 waves (not 5) for a larger wave A with the advance from 1357 as wave B, leaving open a decline to test 1340 as a minimum level for wave C.
I’m going to be very disgusted if we don’t get resolution on the 50dema’s tomorrow