Good morning. Happy Thursday.
The Asian/Pacific markets closed mixed. Hong Kong (up 1%) was the only 1% mover. Europe is currently mixed. Austria (up 2.3%) is the only 1% mover. Futures here in the States point towards a moderate gap up open for the cash market.
The dollar is up. Oil is flat, copper is down. Gold and silver are down.
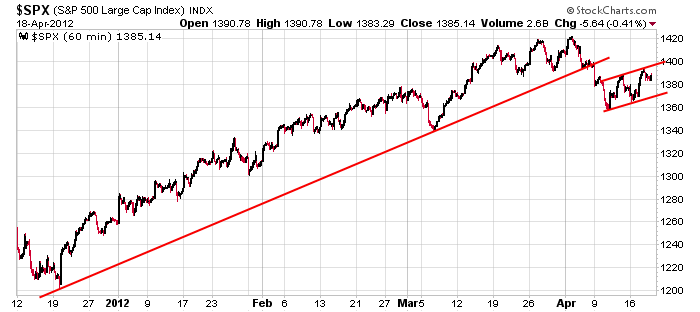
The market remains in consolidation (or distribution) mode. The S&P is unchanged since its post-employment numbers gap down and also unchanged going back 5+ weeks. Here’s the 60-min chart. After breaking a 4-month trendline, the index traded into a small rising rectangle pattern which has bearish implications. A measured move down from the pattern takes the index to about 1310, but my first downside target is 1340 because it served as support in early February and March.

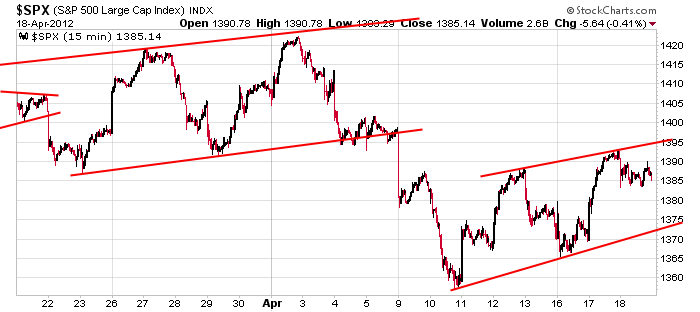
Zooming in with the 15-min chart, a move up may find resistance between 1395 & 1400 and then at the highs around 1420.

Right now I consider the market range bound and very noncommittal. A move in either direction is equally possible, so I don’t have a strong near term bias. This isn’t a bad thing considering we don’t have many very good charts to play. Be defensive. Don’t churn your account while the market sorts things out. More after the open.
headlines at Yahoo Finance
headlines at MarketWatch
today’s upgrades/downgrades
this week’s Earnings
this week’s Economic Numbers
0 thoughts on “Before the Open (Apr 19)”
Leave a Reply
You must be logged in to post a comment.
well it’s clearly obvious moving average lines do not matter. they look like the start finish line at a monster truck race. I wonder if the old days will ever return
Hmmmm, today is tomorrow’s old days >>> Sitar cord <<<
PeteM, I found someone more verbose than you. LOL
I’m guessing these 1000 words mean down today up tomorrow.
The June Dow Jones contract has fired NR7, Inside Day, 2 Day ROC Sell, and 90-10 Low Continuation signals for today’s trading. The NR7 signal tells us to expect range expansion and a pickup in volatility. The Inside Day signal is fired when the day’s trading occurs within the range of the prior day. A subsequent breakout of an Inside Day’s range typically points the way of the next trend move. The 2 Day ROC Sell signal implies that today’s principal trade direction should be to the downside. The 90-10 Low Continuation signal tells us that yesterday’s late day move lower is likely to continue on into today. Cycle Indicators (chart at right) are entering an area where short term cyclical tops often form, but the larger trend is to higher prices. The NR7/Inside Day signal combination tells us to be prepared for a move in either direction. Trade the break of yesterday’s 13049 high to 12952 low range with a stop and reverse on the opposite side as the entry. Price action relative to today’s 12957 Daily Pivot level may provide clues for earlier entry. Note that all US index futures contracts have fired similar Pattern Signals. This means that they can be traded in very similar fashion.
“The NR7/Inside Day signal combination tells us to be prepared for a move in either direction”. Great insight
As frantic as piss on e and crap pile cramer are telling us to buy, they’re stuttering and spitting. I’m pretty sure we’re trying to head down. I think the bounce up this morning is the fed in response to spain
RichE – I’ll try to be succinct. SPX below 1376 means high probability that rally from 1357 is o-v-e-r at 1392ish.
I was just kidding, be as verbose as you like, but a one line summary would be nice.
As Jason has pointed out with the P/C, It could be WS that has an intrest as well as the fed, in keeping this pig up. Monday the tide goes out and we will see who’s naked
I’ve sold AA 3 times and bought twice for 1% moves this morning. not much meat on the bone, but you can only take what this locked up market gives you
Does that make you a, ‘1%er’? LOL
Not much meat on that ‘dog’ bone.
Geesz! I’ve got to stop listening to FOX and MSN.
yes, I love this market 1% of the time. 99% of the time I hate it
Looking like a whipsaw.
ESM12: is testing my bottom tine line.
ouch
SPX 50day EMA and trendline from OCT/DEC lows ready to be broken?!
If ESM12 closes above 1372 then no. This is a big volume day for the futures.
Brian – Succinctly, from SPX 1422 – 3 waves down & from 1357 – 3 up. From 1393? How you see?
From 1393 – appears to be in the midst of a c of 4, IMO stay short below 1384.
That’s 1379 in the Jun contract.
would be very interesting to know who’s buying. I bet the fed is trying to let WS foot the bill as much as possible. However I think WS would let max pain go under this selling swamping.
The public would shit if we saw what this smoothing is costing
Look at GS compared to BKX & XLF. Is GS a forecast of BKX,XLF? IF so, where goes SPX?
XLK & XLF were strongest sectors since DEC, leading the SPX advance. If they can’t hold their 50 day EMAs, will they be the weakest sectors leading the SPX decline? And was XLE’s top in FEB a forewarning of a top in SPX in APR? If so, isn’t that a replay of last year?
Brian – I agree & am looking to short this bounce from SPX 1370 at 1380 or better and cover above 1385.