Good morning. Happy Tuesday.
Most Asian/Pacific and European markets were closed today. Of those open, only Japan (down 1.8%) moved more than 1%. Futures here in the States point towards a flat open for the cash market.
The dollar is down. Oil and copper are down. Gold and silver are flat.
April is in the books. After three big up months to start the year, the Dow was flat, the S&P dropped about 0.75%, and the Nas and Russell dropped around 1.5%. Overall this isn’t bad considering the gains coming in. But it was a challenging month to trade. It started with a losing streak, ended with a winning streak and was choppy and directionless in the middle. For the most part, dips were bought and rallies sold, and the lack of direction forced us to take partial profits on initial moves and move stops tight. It wasn’t a time we could sit back and let patterns play out. Now we move onto May where the adage “sell in May and go away” applies. There are lots of cliches on Wall St, and most don’t work because everyone knows about them. But this one is absolutely true. If you go back in history and study the market’s gains/loss during the year, the Nov-Apr time period significantly out-performs the May-Oct time frame. On a year to year basis anything goes, but overall this tendency shouldn’t be ignored. This doesn’t mean we blindly sell any longs and load up shorts, but it does mean we be a little more careful.
BAC is laying off an additionaly 2000 workers (in addition to the 30,000 they’ve already announced)…mostly from their investment banking, commercial banking and international wealth-management divisions.
For what it’s worth, solar stocks are up nicley before the open. The groups has been one of the worst over the last couple years.
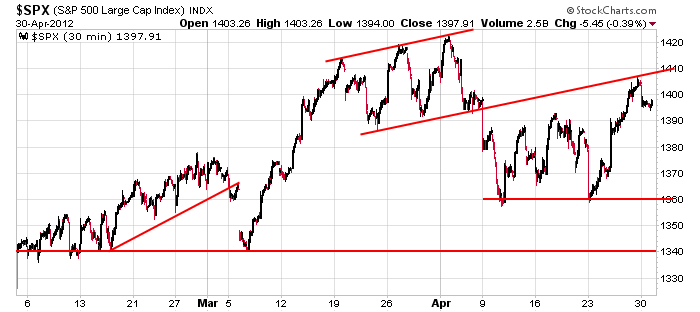
Here’s an update of the 30-min SPX chart. The early-April low was matched and now a higher high made, but yesterday the index got rejected by March’s support trendline extended forward.

More after the open.
headlines at Yahoo Finance
headlines at MarketWatch
today’s upgrades/downgrades
this week’s Earnings
this week’s Economic Numbers
0 thoughts on “Before the Open (May 1)”
Leave a Reply
You must be logged in to post a comment.
Wow! “But this one is absolutely true.” Rule #99 don’t every say absolutely.
ESM12 5d5m: Volume isn’t right. This maybe a markup. Its weird anyway.
yeah. I wonder whats going on
Yo Brian! And a Happy May Day to one & all. I exited my short position on the ISM report at 10am and I’m “standing aside”. There’s too many variables in play but basically, EW aside, it’s a trading range between SPX 1357 & 1422, IMO.
Probably a good decision.
I had a wonderful April. Traded credit spreads on the indexes. All closed out of the money so I was 100% profitable as the seller.
I put in and order for JASO (Chinese solar) yesterday at a low price. I got filled at the end of the day and didn’t even check. When I checked JASO this morning I had a tidy profit already so I took it.
I’m bullish on Chinese solar stocks; however, I’m waiting the commerce departments anti-dumping decision May 17. If you want to be speculative then buy now but not too much.
you shit your shorts? too many variables
EW aside, you’re getting closer
weird popcorn on low volume.
you know joe lunchbox has to pay top dollar for his 1st of the month 401k shit sandwich
You can’t spell baloney?
babaloony–the spx/ndx is not confirming dji new high
short the bull
not yet. they may stick the baloney hard to the shorts before the close. one good fake up
That would depend on how pissed off the market is for Jason saying, ‘Always’.
if they can’t get it up soon profit taking may set in
Brian – when I spoke earlier about there being too many variables, I was referring to potential EW patterns that may be unfolding, e.g. 1) the rally from SPX 1357 could still be wave “b” in progress which tests 1422 and then wave “c” turns down to retest 1357 in a “flat” correction, 2) we are seeing wave “b” of a developing triangle between 1422 and 1357 (less likely, IMO) or 3) we’ve completed wave 4 at 1359ish and completed waves i & ii of wave 5 (from today’s low) and are in the early stages of wave iii which will accelerate on the breakout above 1422, i.e out the trading range between 1357 & 1422.
My apologies in advance to RichE for not being more succinct.
You were succinct, ‘too many variables’.
Hey Pete! (Talking SPX) I didn’t really like 1357 not being taken out on 4/23 – really stretched everything out if we are still in a correction (4 of C). Being what it is, I think your assessment of possible scenarios is well thought out. I think your third option of 5 underway is difficult to count, but possible. My preferred count is a c of b of 4 has or is completing with a c of 4 to come. Failure to drop below 1357 gives rise to a triangle. I don’t consider this remote as it is a common formation prior to a 5.
Yeah right. Let’s follow Big Foot into the woods where the bears are.
Ooops Sorry Brian this s/b attached to Aus.
No problem.
intc up 2%. amat and csco flat. if this squeeze continues tomorrow amat should get some love
Thanks Pete. I’m following along whether you are succinct or not. Good work.
I’m buying a little amat. if we continue this game tomorrow, they might rotate into it and gap it up 1 1/2%
the foot print of big foot insto is telling
he will led us to the bears