Good morning. Happy Tuesday.
The Asian/Pacific markets closed mixed and with an up bias. India dropped 2.2%; there were no other 1% movers. Europe is currently mostly down. Austria is up 1.7%; Greece is down another 3%. Futures here in the States point towards a slight down open for the cash market.
The dollar is up slightly. Oil and copper are down. Gold and silver are down.
Spain is bailing out its third largest bank. HSBC, Europe’s largest bank, reported net profit of $2.58B (down from $4.15B a year ago).
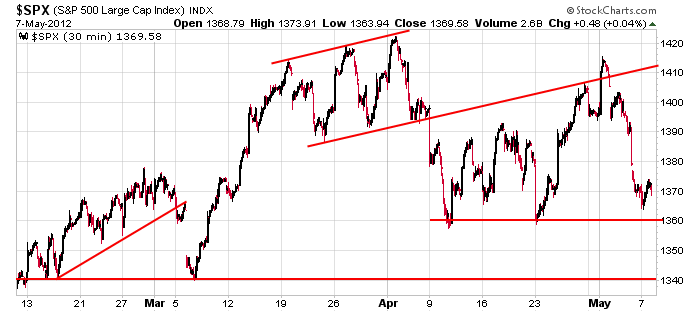
Yesterday wasn’t a horrible day. The Asian/Pacific markets suffered stiff losses. Greece fell 7%. The incumbent in France lost. Europe overall dropped. The US markets had an excuse to cave but they didn’t. The lows were established early, and the indexes closed mostly flat on the day. Closing flat on a day when lots of negative news is out is a good performance. It’s not good enough to turn me bullish, but it’s good enough to take note. Here’s an update of the 30-min S&P chart. Support still sits at 1360 and 1340.

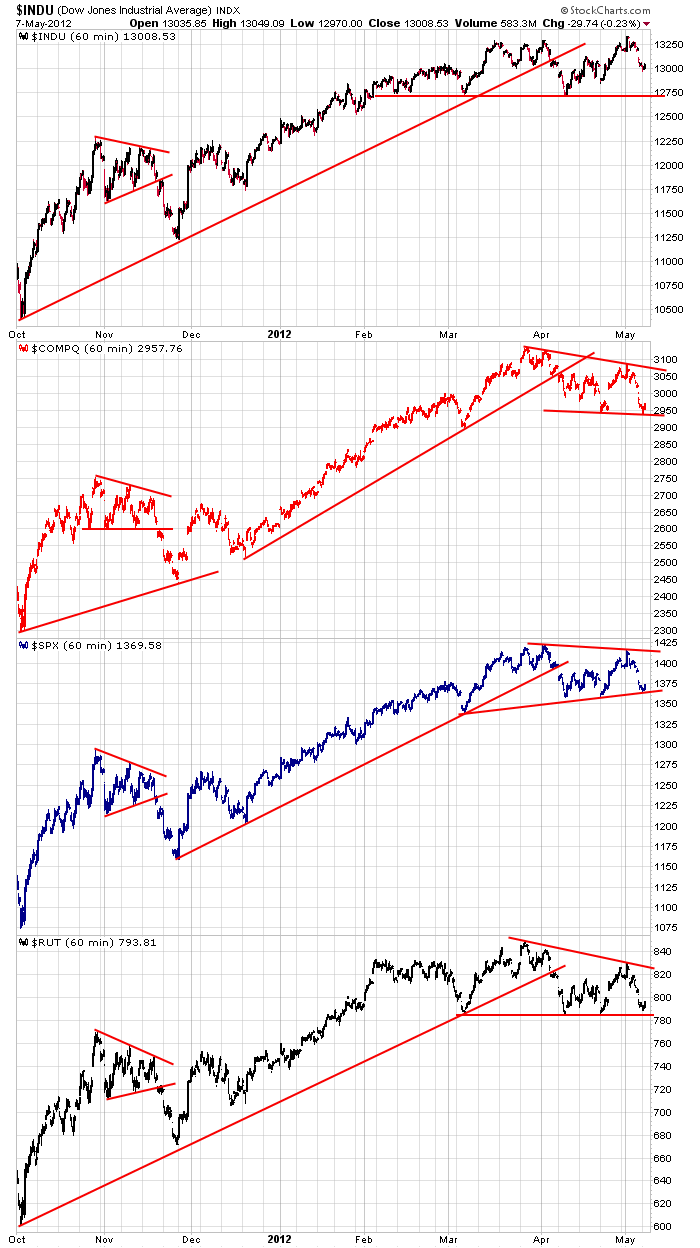
But as bad as sentiment has gotten recently, let’s back up and remind ourselves what the intermediate term charts look like. In all cases below, I’d consider the indexes to be in 2-month consolidation patterns. It’s entirely possible they break down; it’s also possible a hint of good news moves them back up. Lots of bad news has hit lately, and the market has not broken.

I lean to the downside right now, but keep an open mind. The market has a way of surprising us. More after the open.
headlines at Yahoo Finance
headlines at MarketWatch
today’s upgrades/downgrades
this week’s Earnings
this week’s Economic Numbers
0 thoughts on “Before the Open (May 8)”
Leave a Reply
You must be logged in to post a comment.
In EW terms, there’s always the possibility of a wave 3 extension in progeress, but at the same time, from 1422, c=a at 1350 and from 1415, 5=1 (of c of larger wave 4) at 1353ish. So, I covered a short position below 1357 and wait to see if there’s action below 1350 and a reversal. If a reversal occurs, the key would be whether the subsequent rally unfolds in 3 or 5 waves.
sox broke the neckline and is sitting on the 200
Check out RUT daily chart. Test of neckline of potential H&S top, IMO.
thats the sp 600 I’ve been pointing out the last 3 days einstein
You can understand if I don’t pay much attention to your comments.
maybe, maybe not )oo(
thats one reason you’re ignorant of whats going on. I’m told it’s blissful
It tested it today and is still holding.
Long term Up, with the EU selling-off (my prediction) the money will go to China or the U.S. I think the U.S. Where else is the money going to go?
@RichE – agreed. If you want to invest in equities then the US and China are the preferred choices.
I prefer to trade. I invest in nothing. So I’ll trade any market.
45 min. keep your eyes open for a white horse
Brian – I’m seeing today’s action as more of a wave 3 extension which may be ending below 1350 to be followed by a rally to SPX 1374 or higher. So, I’m going to cover my remaining short on a retest of today’s low, ideally somewhere below 1350. What are you seeing from the ES futures perspective?
I’m seeing a retest of the Sunday early evening low of 1342.5 and expect it to fail after an attempted rally that should loose steam 1352. I’ve lowered my stop to 1357.
I wanted to cover below 1350 but got out at 1351 instead. In a shorter time frame, it’ll be interesting to see if SPX 1357-59 proves to be resistance to this initial rally attempt. I don’t want to lose a longer term perspective that wave c of 4 could end at or above 1340 and may have ended this morning or with a new low today/tomorrow.
I’m still working on the assumption that c of 4 will still come close to the target 1333 (1340 cash).
Brian – I’m working on the assumption that, from SPX 1415, we’ve either completed 3 waves down at today’s low or 5 waves down (completing larger wave 4 of C). Therefore, looking at the hourly chart, a 3 wave advance testing 1374ish (previous 4th wave of lesser degree) to the 1376ish (50 day ema & dropping) would suggest we may still have minor wave 5 down to go to complete larger wave 4 of C. 5 waves up suggests that wave 4 of C is completed and we’re headed for at least a test of 1422 or, at minimum, a test of 1390ish. I have no positions long or short, but the guidelines to act upon are present, from an EW perspective.
EW aside, the 10, 20 & 50day EMAs have rolled over and are converging in what could likely be the mid 1370-1380 area fpr important resistance near term.
I’m still holding short. Futures are having trouble advancing beyond 1352. My stop is in place and will still result in a profitable trade if executed.
Pete, looks like things are playing out the way you anticipated.
I think we’re setting up for a test of the EMAs I mentioned earlier.
well now that the cash has caught up to the mon morn asian futures trade–ur sun nite
what now
What now? Well,,,,,,,
With the volume above average they’ll be a ground swell of mushrooms in the caves. The bears will eat the mushrooms and think everything is cool so they’ll start studying EW in the meantime the bulls will graze to greener pastures (solar).
it is interesting to note that the cash live market is simply the futures price
plus /minus fair value ie dividends ect and that has to be so by law and the exchanges have to bring them into line if they get to far outside each other–see index arb .com
so imo the futures are the most important