Options expire this Friday, so let’s take a look at the open-interest on SPY, DIA, QQQ and IWM to see if they hint at movement the rest of the week. Here’s the theory: the market conspires to cause the most pain, to cause the most number of people to lose the most amount of money. If the market is to accomplish this, what does it need to do this week?
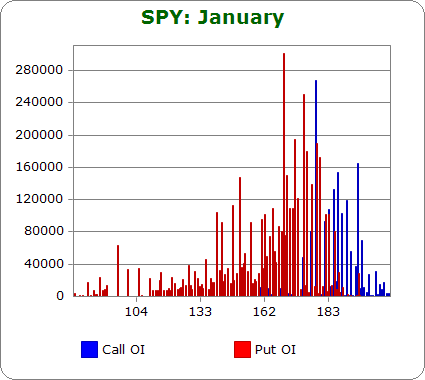
SPY (closed 181.65)

Puts out-number calls 2.1-to-1.0
Call OI is highest between 180 and 190, with 180 being the biggest spike.
Put OI is highest between 170 and 183, with 170 being the biggest spike.
Overlap takes place in the 180-183 area, and since puts dominate calls, a close near the top of that range would produce the most pain. Today’s close was at 181.68 – a perfectly acceptable level, but not ideal. Flat trading the rest of the week would do the trick, a small move up would be even better.
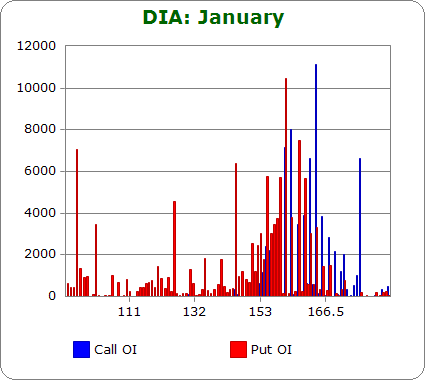
DIA (closed 162.24)

Puts out number calls 1.4-to-1.0.
Call OI is highest 160, 161, 164, 165 and 175.
Put OI is highest at 159, 160 and 162.
The DIA put/call open-interest is never important because volume is so low, but for the sake of completeness, here goes. There isn’t a clear level call and put OI meets, so I’ll guess. The 160-161 area seems ideal. Today’s close was at 162.24 – slightly higher than ideal, so a slight move down is needed.
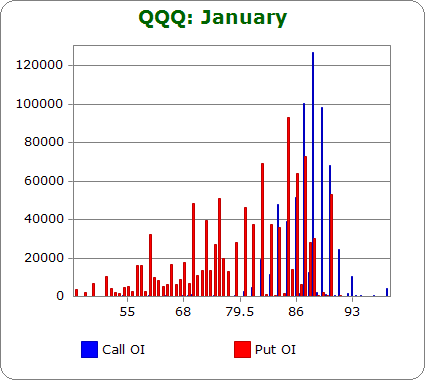
QQQ (closed 86.91)

Calls out-number puts 1.4-to-1.0
Call OI is highest between 86 and 88, with 85 and 89 also sporting decent OI.
Put OI is highest between 85 and 87 and at 90.
There’s overlap between 86-87, so a close there would cause the most pain among call and put buyers. Today’s close was at 86.91 – a perfect level. Flat trading the rest of the week is needed.
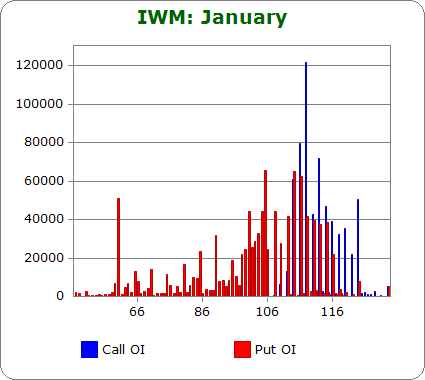
IWM (closed 113.94)

Puts out-number calls 2.2-to-1.0
Call OI is highest between 110 and 114, with 112 being biggest spike.
Put OI is at 107 and then between 109 and 115.
There’s a big overlap zone between 110 and 114, so regardless of where IWM closed, somebody’s going to make money. Today’s close was at 113.94 – the top of the zone. A close here will cause a lot of pain, but a slight move down would cause more pain.
Overall Conclusion: 2014 started with many quiet days…then today the market got smacked. The question is: is the invisible force of the put/call data stronger than the momentum that began today? If the data is right, if the market is going to move so that the most number of option buyers lose the most amount of money, the market will trade flat the rest of the week. But if the negative Histogram divergence and today’s momentum mean anything, the market is more likely to follow through to the downside…at least a little.
0 thoughts on “Using Put/Call Open Interest to Predict the Rest of the Week”
Leave a Reply
You must be logged in to post a comment.
Thanks,Jason
i had expected more calls to puts overall,with the bullish nature of the market
and that it is in its exhaustion toping part of the cycle
i wouldnt expect the market to be flat the rest of the week but it does give us a general target to head for for frid
if its a volitile week new puts/calls can alter the pitcher a bit