Options expire this Friday, so let’s take a look at the open-interest on SPY, DIA, QQQ and IWM to see if they hint at movement the rest of the week. Here’s the theory: the market conspires to cause the most pain, to cause the most number of people to lose the most amount of money. If the market is to accomplish this, what does it need to do this week?
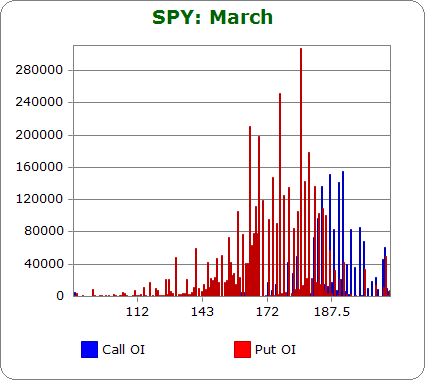
SPY (closed 186.33)

Puts out-number calls 2.2-to-1.0…more bearish than last month.
Call OI is highest between at 180 and then between 184 and 194.
Put OI is highest between 160 and 187.
Puts dominate, so let’s focus on where SPY has to close to cause most of those to be worthless Friday. Luckily the overlap region is relatively small, so causing the puts to close worthless will not require call buyers to make a lot of money. The overlap region is between 184 and 187 (not including the call spike at 180). A close in the range would cause the most pain while allowing those 180 call buyers to cash in. Today’s close was at 186.33 – a good level, so no movement is needed the rest of the week to cause max pain.
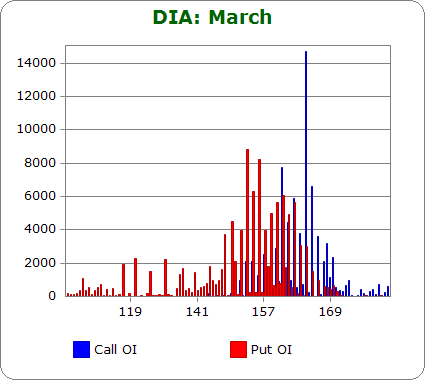
DIA (closed 162.37)

Puts and calls are nearly equal at 1.5-to-1.0….more bearish than last month.
Call OI is highest between 160 and 165 with the big spike taking place at 164.
Put OI is highest between 151 and 162 with the cluster of highest spikes taking place at 154-156.
There’s overlap in the low 160’s, so a close there would cause the most number of DIA options to expire worthless. Today’s close was at 162.37, an acceptable level, so no net change is needed the next four days to cause max pain.
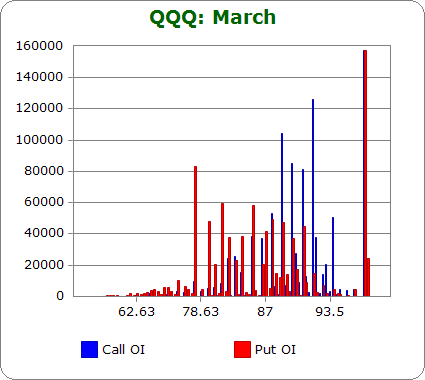
QQQ (closed 89.45)

Calls out-number puts 1.1-to-1.0…about the same as last month.
Call OI is highest between 89 and 92 (technically this isn’t exactly right because QQQ paid a dividend, but it’s close enough for our purpose), and there’s a big spike at 99.
Put OI is steady between 78 and 91, and then there’s a big spike at 99.
First off, the spike at 99 can be ignored. The same source is responsible for calls and puts at that level…the source is likely locking in a price and is not indicative of underlying sentiment. Between the other strikes, there’s overlap between 89-91. A close somewhere in there would cause most calls and puts to expire worthless on Friday. Today’s close was at 89.45 – exactly where it needs to be, so no net change is needed the rest of the week to cause max pain.
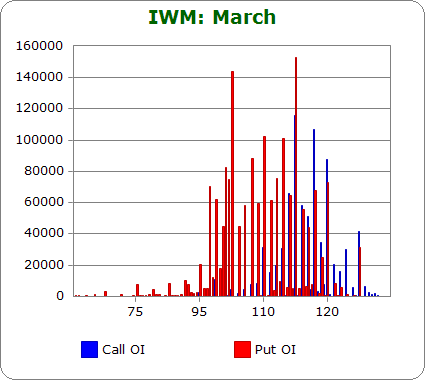
IWM (closed 118.06)

Puts out-number calls 2.9-to-1.0…more bearish than last month.
Call OI is highest between 114 and 120.
Put OI is highest between 98 and 120 – a very large range.
Puts dominate, so it’s more important the puts close worthless than the calls. There’s overlap in the 114-120 range (the entire high-call strike range), and with our desire for the put buyers to feel more pain, a close in the upper half of the range would be ideal. Today’s close was at 118.06 – a perfect place to cause most of the puts worthless while only letting a few lower strike call buyers make money. No movement is needed to cause max pain.
Overall Conclusion: For what it’s worth, the SPY and IWM numbers stated above are more bearish than previous months. As far as the usage of the numbers, the market is already positioned to cause max pain. In all important cases, the ETFs above are already positioned such that the most number of calls and puts will expire worthless, so no movement is need the rest of the week.
0 thoughts on “Using Put/Call Open Interest to Predict the Rest of the Week”
Leave a Reply
You must be logged in to post a comment.
How about some back test results? Or, the results of your ‘overall conclusions’ since you have been analyzing this theory. Just don’t see the point of this unless you know how it has played out in the past.
G…I agree some back test results would be helpful. It wouldn’t be hard…although it would be time consuming. All the reports are here, and of course anyone can get a 3-year chart of the indexes and match up the predictions with what eventually happened. I’m not going to do it. I don’t trade off the analysis, and I’ve even considered stopping their publication…but traders ask for it, so I do it.
If someone wants to manually back test the analysis, I’d like to know the results…but I have no desire to do the test myself.
I understand and thanks for your reply. I just think traders should have a greater perspective on what this means and what is not being revealed without an historical back test. This missing piece is significant.
Nailed it! Wow!