The bears have been out in full force lately. Several times since the market bottomed in 2009 they’ve gotten a whiff of a potential downtrend, and they’ve always shown up salivating at the mouth at what finally looked like a chance to show the world everything they had been saying was true – even though it wasn’t.
Today I’m going to do a 2011/2015 analog. That’s where you compare similar chart formations from two different times. I don’t do this to predict what will happen, but rather to force us to keep an open mind and not get too biased in one direction.
In the summer of 2011, the market was trading in a range while the internals deteriorated. A debt downgrade of the US government acted as a trigger that led to the S&P 500 dropping about 200 points (I’m not going to pinpoint the exact top).
This summer (2015), the market traded in a range while the internals deteriorated. An implosion the in Chinese stock market acted as a trigger that led to the S&P 500 dropping about 200 points (again, not pinpointing the top), which on a percentage basis was much less than the 2011 drop because the index started at a higher level.
Let’s compare some charts of the two time periods.
Here are the 2011 and 2015 versions of the S&P 500, from Feb 1 until about 14 days after the market bottomed. They sport similar patterns. A summer range followed by a very quick plunge.
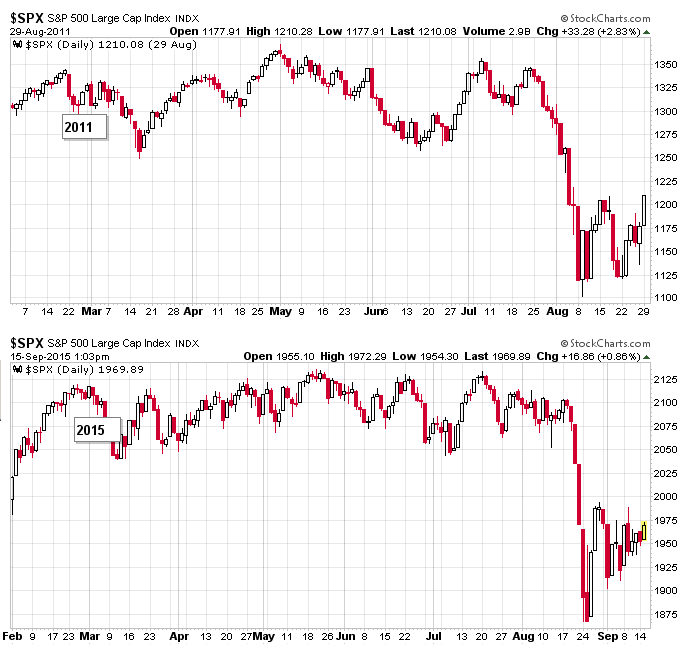
As stated above, the 2011 drop was ignited by a downgrade of US debt while the 2015 drop points to China as the catalyst. But it’s my contention the market was deteriorating prior to the drops, and the sell-offs would have happened anyways. Let’s check out the internals.
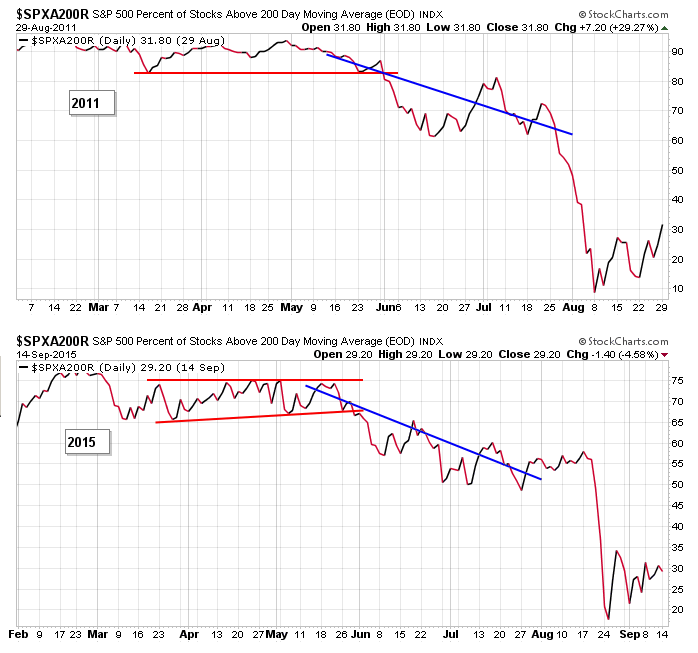
In both cases, the percentage of SPX stocks above their 200-day MAs had broken down at the beginning of June of each year, and by the time the downside air pocket was hit, they were already trending down for two months.
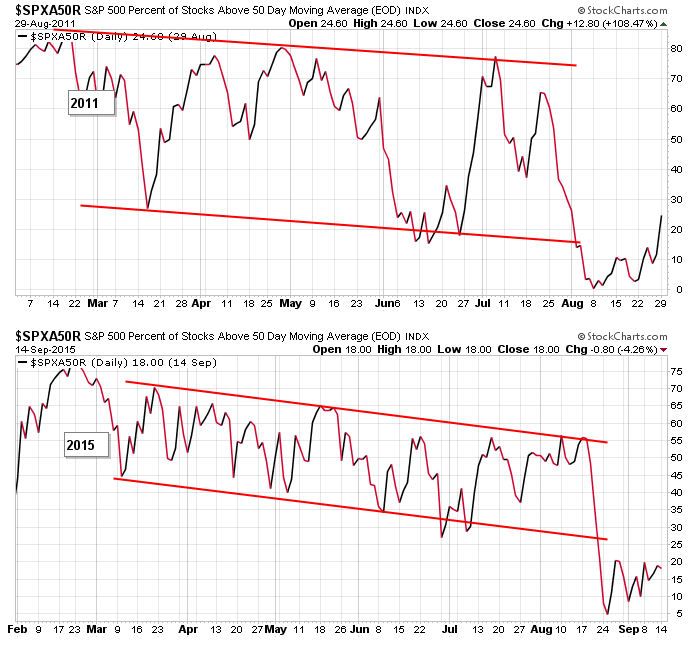
The same charts using the 50-day instead of the 200-day are also similar. The 2011 version is wider, but both suggest successive new highs from the underlying indexes were accompanied by fewer stocks moving above this key moving average. Deterioration was taking place. Fewer stocks were participating in each rally.
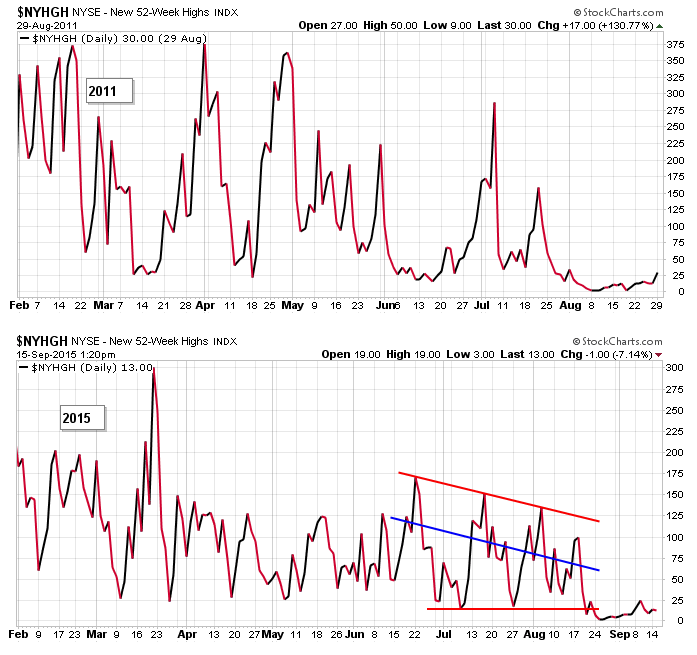
In both cases new highs had been declining for a couple months, and prior to the floor being pulled out, they were already at their lows of the year. Again, participation was waning well before the events that triggered the sell-offs took place.
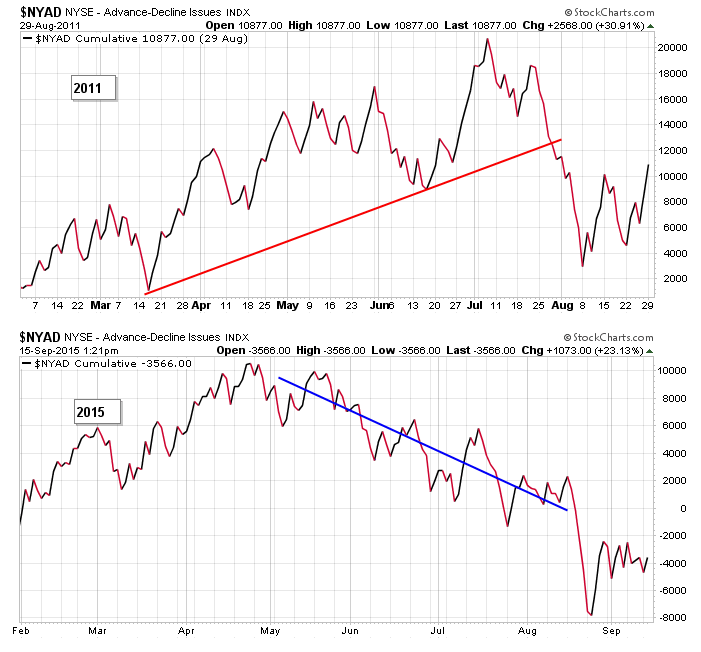
Slightly different overall picture here with the cumulative AD line, but the near term picture, the action just prior to the plunges, was similar. This year, the AD line had been declining for several months when the market finally dropped. In 2011, the AD line was in good shape until the two weeks prior to its drop.
The S&P bullish percent charts hint at the same internal deterioration – less and less stocks participating as the summer range developed.
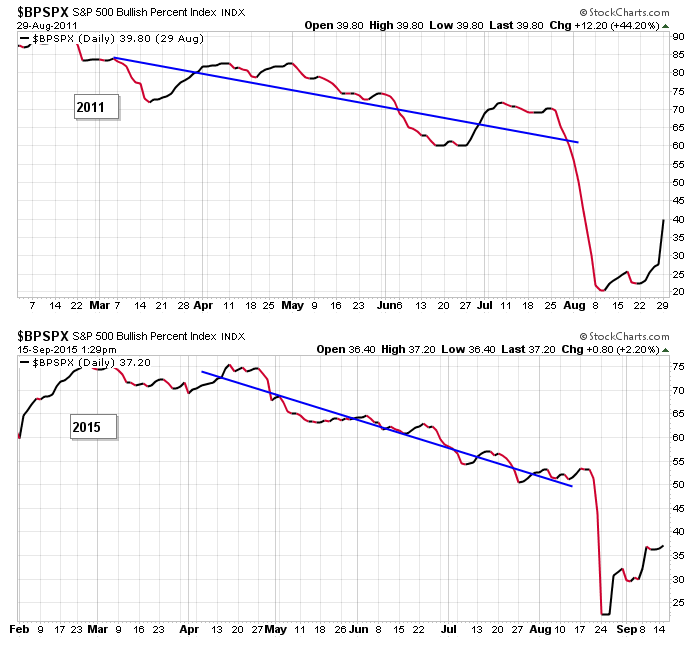
So 2015 is nearly identical to 2011 – both in terms of price drop, timing and the internals leading up to the plunges.
What happened in 2011?
The S&P spent almost two months chopping around in a relatively big range. Then, after taking out its low, it surged more than 200 points in one month. It wasn’t all clear sailing from there, but the bottom was definitely in place, and the market did continue its uptrend which had begun 2-1/2 years prior.
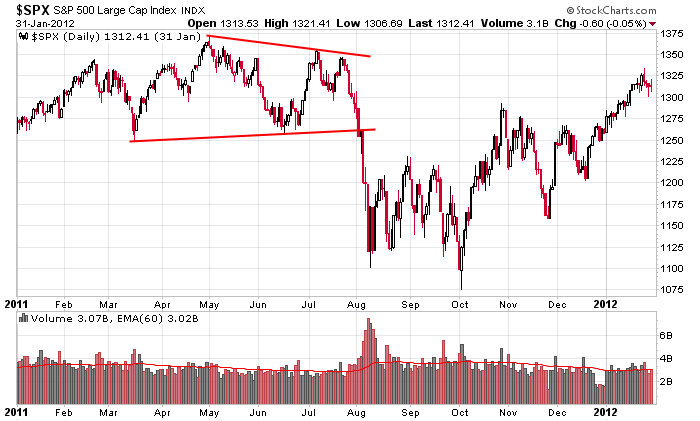
Am I predicting this will happen again? No, not a chance. I would be shocked if the market rallied 40% off its low in one year (which is what happened in 2011), but chopping around and then rallying into the end of the year is certainly realistic.
Be open-minded. Unless there’s something hiding we don’t know about, odds of a bear market developing are small.
0 thoughts on “2011/2015 Analog”
Leave a Reply
You must be logged in to post a comment.
Excellent analytical comparison.
Thanks for sharing this with us.
Thank you Jason and very interesting and yes we have to have a open mind with no bias
however i point out the difference and similaralities
1– 2011 was only 2 years into this fantasy bull and since then the can has been kicked down the road another 4 years to a mature bull in a old age home
2 the can kicking by politicans and central banks has lead to a far worst situation now —crippleing DEBT
WORLD WIDE
3–Wether we get a xmas rally depends on TA and future events
if we get a move down to finish a five wave ,wave 1 then we could get a masive wave 2 back up
4– but as we saw with china ,usa does not live in a vacume cleaner
5–what happens in europe and debt and money swaps and greek elections and further soverign defaults we effect the world
and funnily enough may push usa equities higher after a further crash as money floods into usa
6 the catapult effect of europe will bankrupt already bankrupt japan and finally in 2017 usa
7 no their are a lot of difference the biggest is volitility and large moves and we may get crash /recovery crash /recovery etc
8–NOW THATS ALL HYPOTHETICAL AND NO ONE KNOWS SO NOW WE HAVE A DOJI MIND SET -NO BIAS AND BE WILLING TO MOVE FAST AND DEFINITLY A OPEN MIND TO ALL SITUATIONS AND BE WILLING TO CUT LOSSES IF NEED BE
THATS GOOD MONEY AND TRADE MANAGEMENT
your charts have been noted and Thank You
Thanks for you comments Aussie.
#5 on your list is very interesting. Even if the US is in bad shape, Europe and Asia are worse, so money may flow into the US.
#4 on your list…I read less than 2% of business from the S&P 500 comes from China, so a big cut in China has little effect here. Emotionally people will get wrapped up in it, but it won’t affect business much.
And when I say I don’t see a bear market on the horizon, that doesn’t mean I see a bull market either. The US could trade range bound for several years – a trader’s paradise.
Very good observations!
Great work!!!
Great quote “odds of a bear market developing are small.” .. I second!
great comparism
hI jason
i compare the 2011 chart and if you extend out your chart to end sept beg oct it could be almost identical
it indicates a wave 4 now and a wave 5 drop down to end sept
using Gann t/a it was 89 days high to low [normal incriments of 90 days ]
TOMORROW thurs 17th sept is 90 days on the down side—FED DAY
but i will only still daytrade it as above is only probability daytrading is reality